Free Access
Fig. 1.
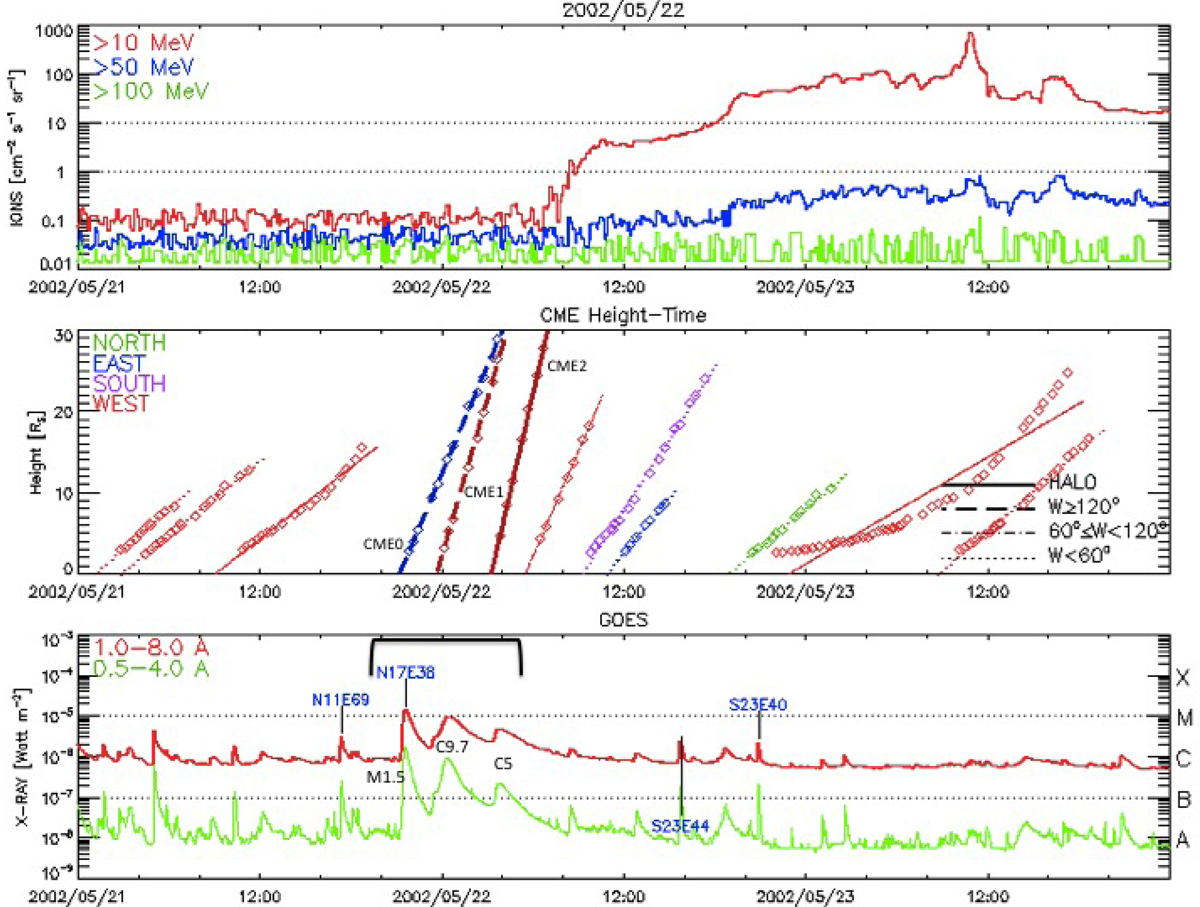
Events of 2002 May 21–22. Top panel: solar energetic particles (SEP) for three frequency bands. Middle panel: trajectories of the studied CMEs, respectively, CME0, CME1, and CME2. Bottom panel: X-ray flares. The class of the three involved flares is indicated at the peaks in the green curve.
Current usage metrics show cumulative count of Article Views (full-text article views including HTML views, PDF and ePub downloads, according to the available data) and Abstracts Views on Vision4Press platform.
Data correspond to usage on the plateform after 2015. The current usage metrics is available 48-96 hours after online publication and is updated daily on week days.
Initial download of the metrics may take a while.