Fig. 8.
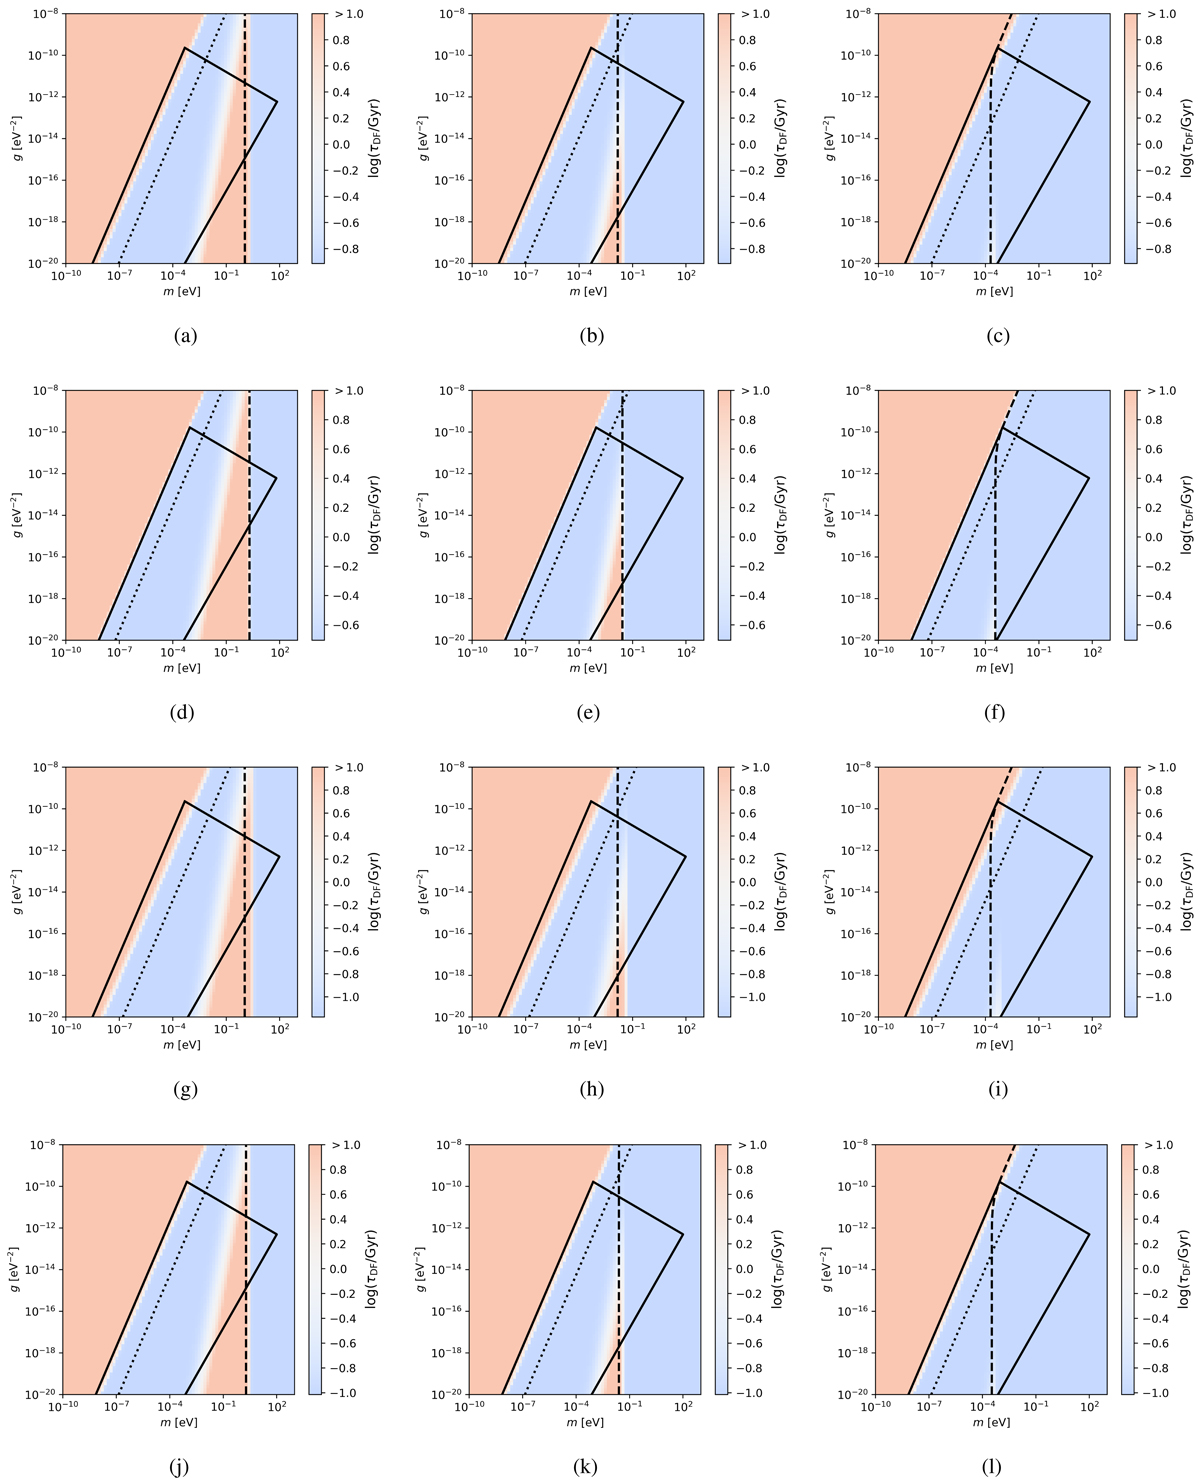
Decay time of GC3 and GC4, as listed in Table 2, in the LC and WC models for the Fornax dSph density profile from Table 1 (solid line). Permitted parameter space; the left side is from the constraint on the halo core radius in hydrostatic equilibrium, Eq. (82); the upper right side from the constraint from galaxy cluster collisions, Eq. (84); and the lower right side from the minimum relaxation rate needed to thermalize the fluid across the halo, Eq. (86) (dotted line). Criterion for linear perturbation theory to be properly valid, with δρ/ρ0 < 1 satisfied on left side (dashed line). Limit due to a hydrostatic halo with thermal pressure included, with resulting core radii smaller than the core of the Fornax dSph as modeled by Eq. (80) to the right. Changing the temperature only changes the decay time of the normal fluid phase, as well as the crossover from superfluid to normal fluid. However, for the temperatures shown and lower, the normal phase is well outside the parameter space where perturbation theory is valid. (a) GC3 LC, T/Tc = 10−2. (b) GC3 LC, T/Tc = 10−4. (c) GC3 LC, T/Tc = 10−6. (d) GC3 WC, T/Tc = 10−2. (e) GC3 WC, T/Tc = 10−4. (f) GC3 WC, T/Tc = 10−6. (g) GC4 LC, T/Tc = 10−2. (h) GC4 LC, T/Tc = 10−4. (i) GC4 LC, T/Tc = 10−6. (j) GC4 WC, T/Tc = 10−2. (k) GC4 WC, T/Tc = 10−4. (l) GC4 WC, T/Tc = 10−6.
Current usage metrics show cumulative count of Article Views (full-text article views including HTML views, PDF and ePub downloads, according to the available data) and Abstracts Views on Vision4Press platform.
Data correspond to usage on the plateform after 2015. The current usage metrics is available 48-96 hours after online publication and is updated daily on week days.
Initial download of the metrics may take a while.