Fig. 9.
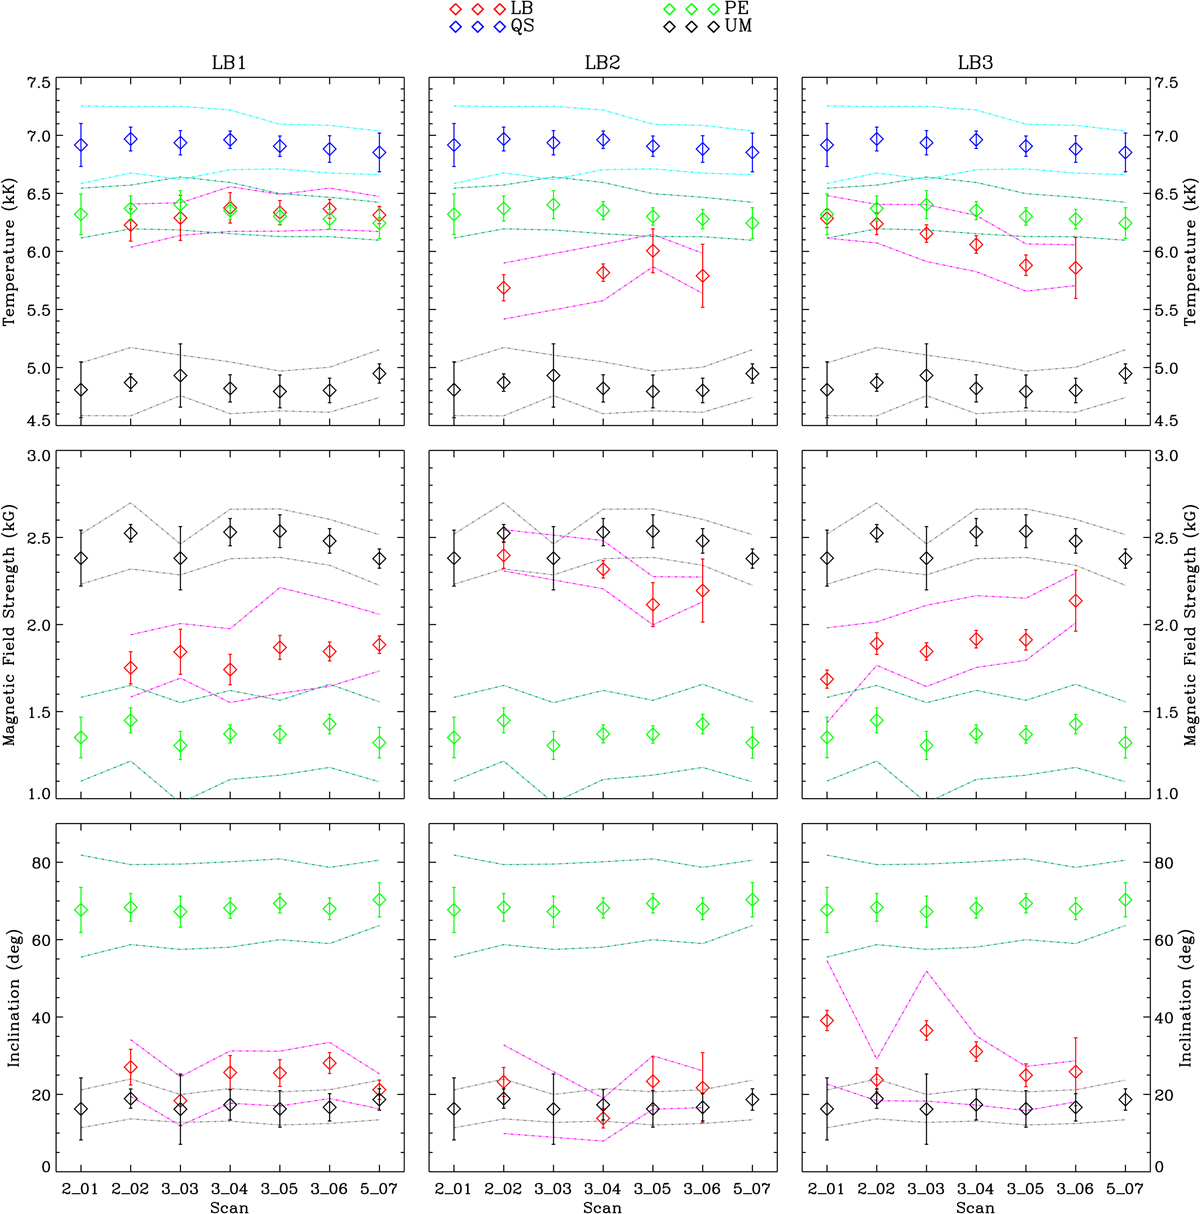
From top to bottom: temporal evolution of temperature, inclination, and magnetic field strength, respectively, averaged over the optical depth values of the left column of Table 5 and over the LB, UM, PE, and QS pixels. From left to right: LB1, LB2, and LB3, respectively. Black and grey lines are for UM values, red and pink for LB pixels, and light and dark green for the PE, and, in the temperature panel, light and dark blue for the QS pixels. The diamonds correspond to the values and the dash-dotted lines indicate the 25th and 75th percentiles. The x-axis represents the scan, of which the format is day_scan-number.
Current usage metrics show cumulative count of Article Views (full-text article views including HTML views, PDF and ePub downloads, according to the available data) and Abstracts Views on Vision4Press platform.
Data correspond to usage on the plateform after 2015. The current usage metrics is available 48-96 hours after online publication and is updated daily on week days.
Initial download of the metrics may take a while.