Free Access
Fig. 8.
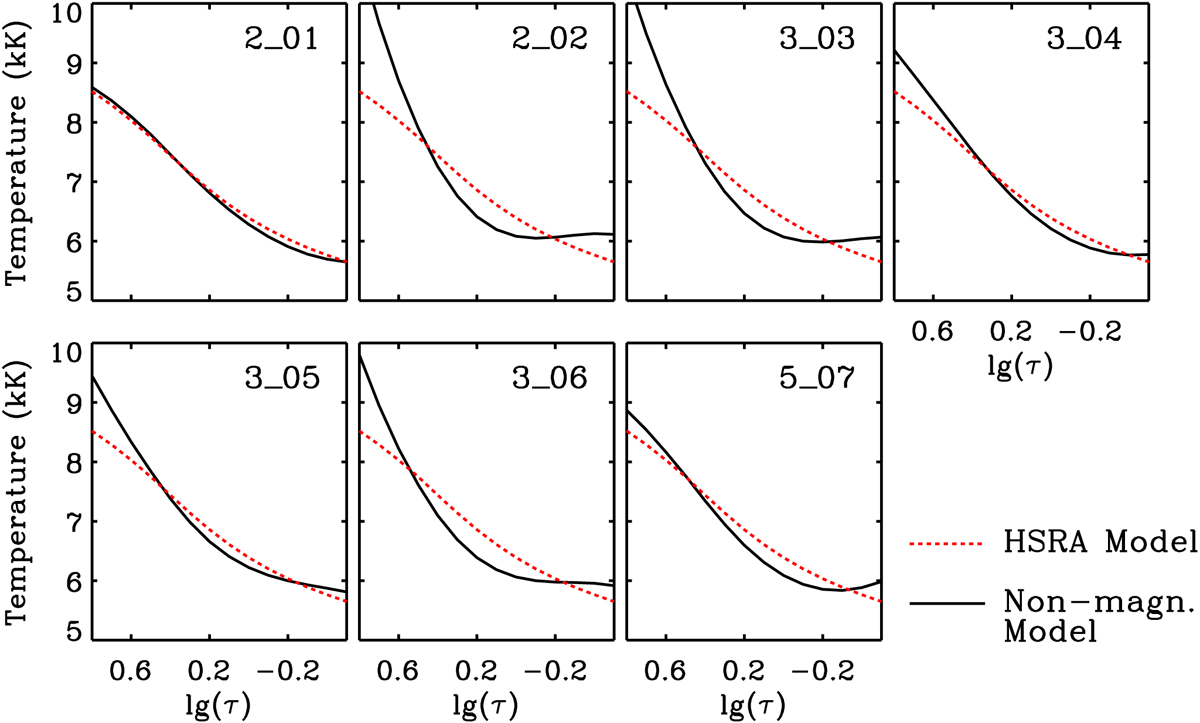
Temperature stratifications. The solid dark line corresponds to the non-magnetic component for each observed map represented between the optical depth values of the left column of Table 5. The red dotted lines correspond to the temperature stratification of the HSRA model.
Current usage metrics show cumulative count of Article Views (full-text article views including HTML views, PDF and ePub downloads, according to the available data) and Abstracts Views on Vision4Press platform.
Data correspond to usage on the plateform after 2015. The current usage metrics is available 48-96 hours after online publication and is updated daily on week days.
Initial download of the metrics may take a while.