Fig. 7.
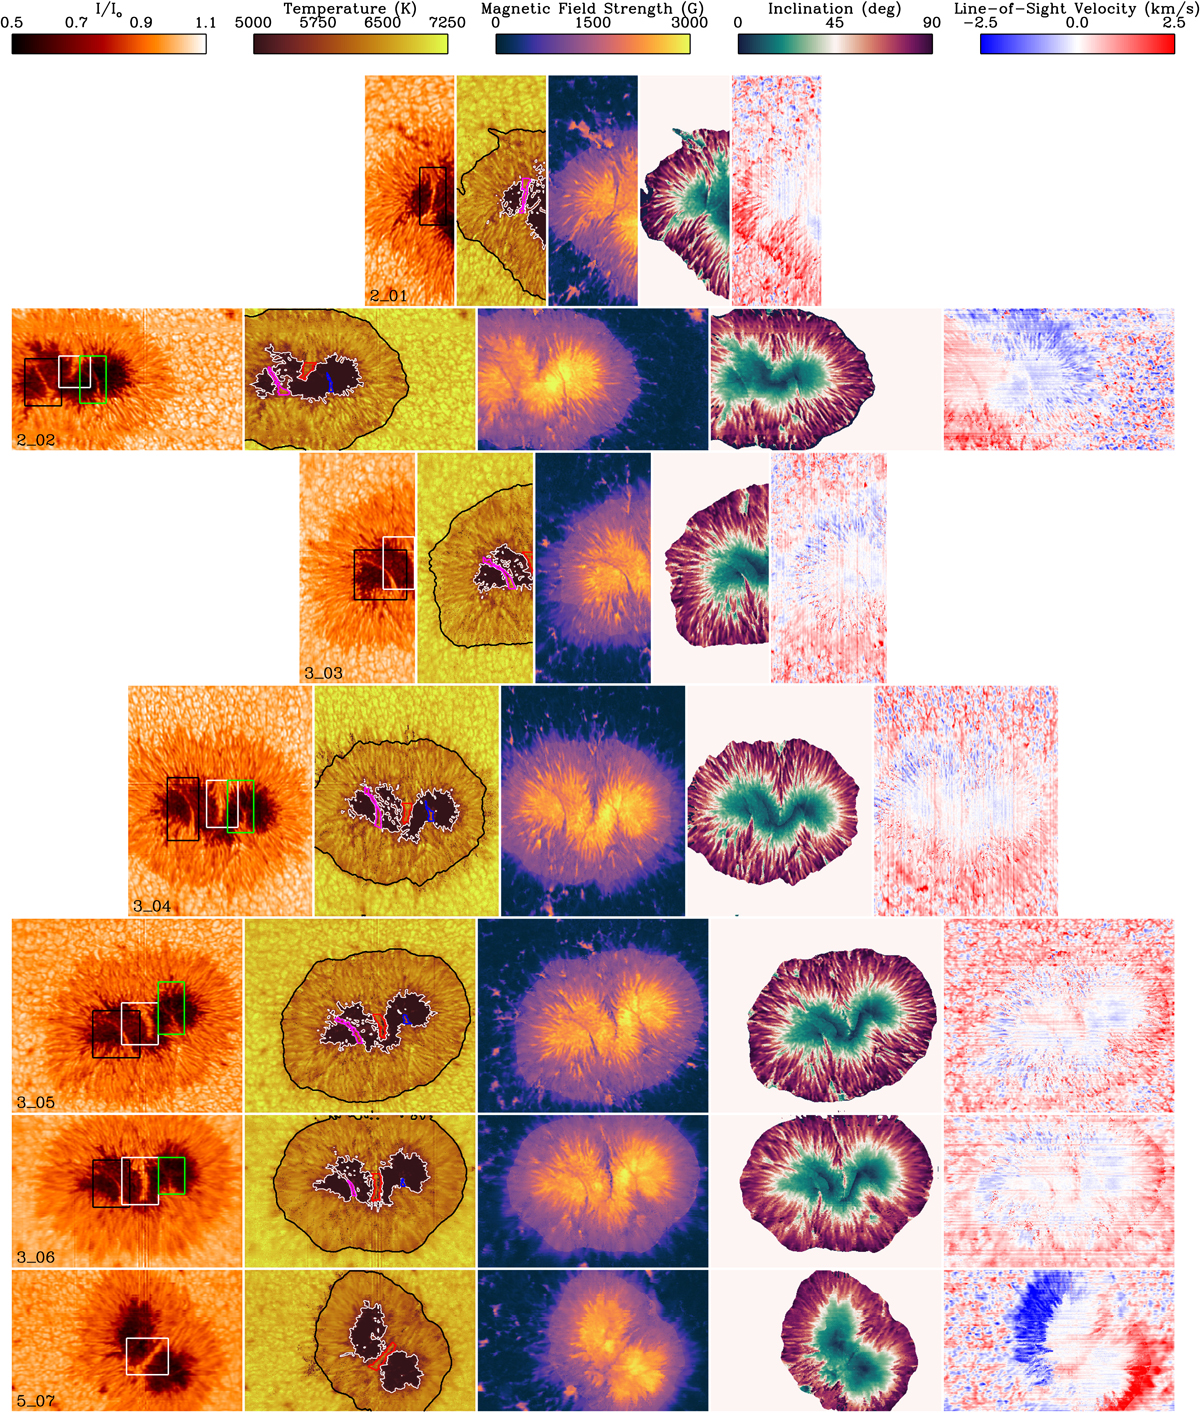
Maps of the atmospheric parameters obtained after the Stokes parameter inversions for the magnetic atmosphere averaged in optical depth between the values shown in Table 5 (Sensitivity Range column). Columns (from left to right): normalised observed continuum intensity with respect to the QS, temperature, magnetic field strength, inclination in the solar reference frame, and velocity in the line-of-sight reference frame. The rectangles drawn on the intensity maps mark the regions used in the next section to analyse the different LBs. The white square indicates LB1, the green one is the area taken for LB2, and the black one corresponds to LB3. The contours represent the different areas taken for analysis of the results. The black, white, red, blue and pink contours mark the PE, UM, LB1, LB2 and LB3, respectively. The labels indicate the observation day and the number of the scan of the third column of Table 1 (observationDay_scan).
Current usage metrics show cumulative count of Article Views (full-text article views including HTML views, PDF and ePub downloads, according to the available data) and Abstracts Views on Vision4Press platform.
Data correspond to usage on the plateform after 2015. The current usage metrics is available 48-96 hours after online publication and is updated daily on week days.
Initial download of the metrics may take a while.