Fig. 6.
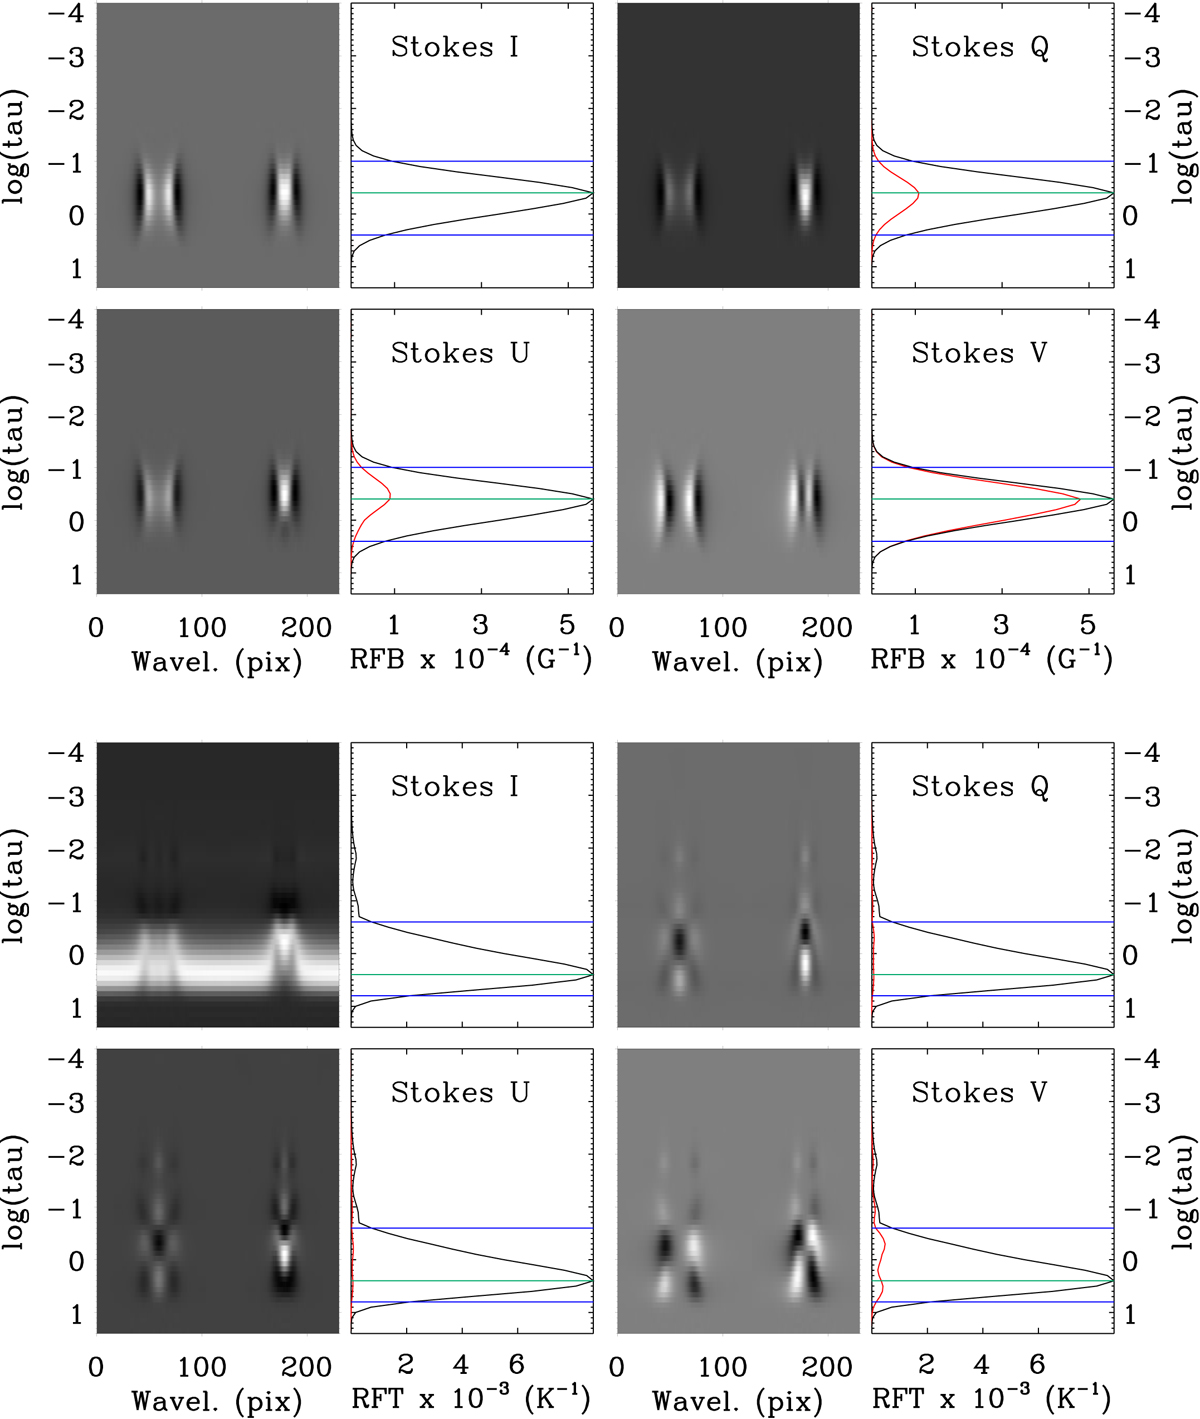
Response functions of the Stokes parameters of the spectral lines used in the inversion of the magnetic field strength (top eight panels) and of the temperature (bottom eight panels). Each map was normalised to its total absolute value. The left line corresponds to the 15648.515 Å spectral line and the right one to 15662.018 Å. The grey scale images show the RFs of the four Stokes parameters, and the plots on the side depict the integral of each RF along the wavelength direction. The graphs depict the integral of each RF in the wavelength direction. The horizontal blue lines mark the optical depths for which the area of the integrated RF between these blue lines adds up to 95% of the total, and the green horizontal line corresponds to the optical depth where the integrated RF is maximum.
Current usage metrics show cumulative count of Article Views (full-text article views including HTML views, PDF and ePub downloads, according to the available data) and Abstracts Views on Vision4Press platform.
Data correspond to usage on the plateform after 2015. The current usage metrics is available 48-96 hours after online publication and is updated daily on week days.
Initial download of the metrics may take a while.