Fig. 5.
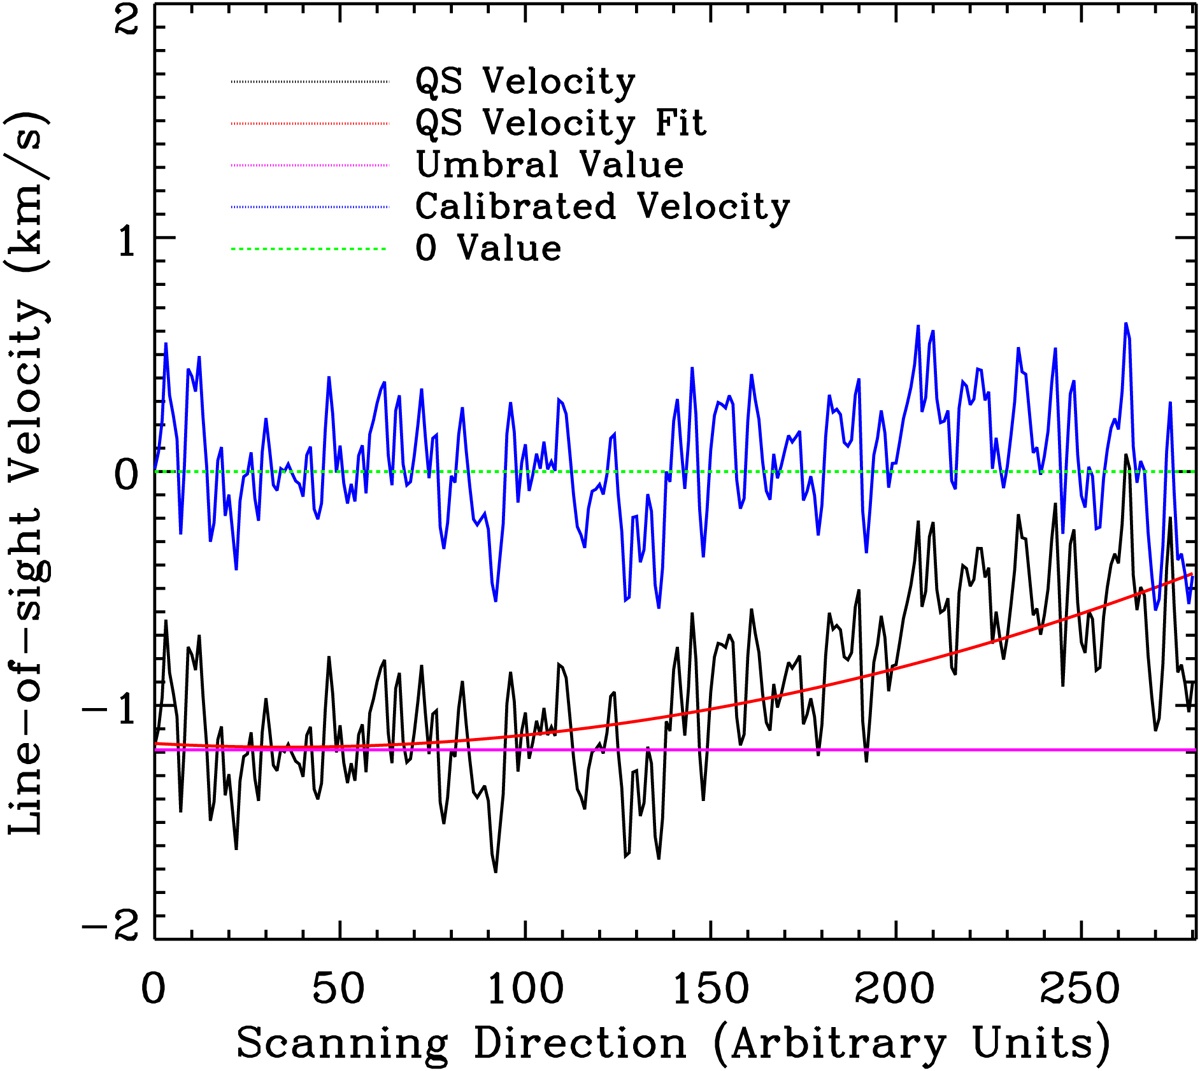
Velocity calibration: The black line represents the average vlos of the QS area of Scan 3_05 along part of the slit used to correct the trend produced by an instrumentation problem. The red line is a second-degree polynomial that fits the black line. The pink line corresponds to the value obtained by averaging the velocity of the UM after correcting the instrumental trend. Finally, the blue line corresponds to the final result of the averaged QS vlos after applying the previous corrections. The green line marks the 0 value.
Current usage metrics show cumulative count of Article Views (full-text article views including HTML views, PDF and ePub downloads, according to the available data) and Abstracts Views on Vision4Press platform.
Data correspond to usage on the plateform after 2015. The current usage metrics is available 48-96 hours after online publication and is updated daily on week days.
Initial download of the metrics may take a while.