Fig. 4.
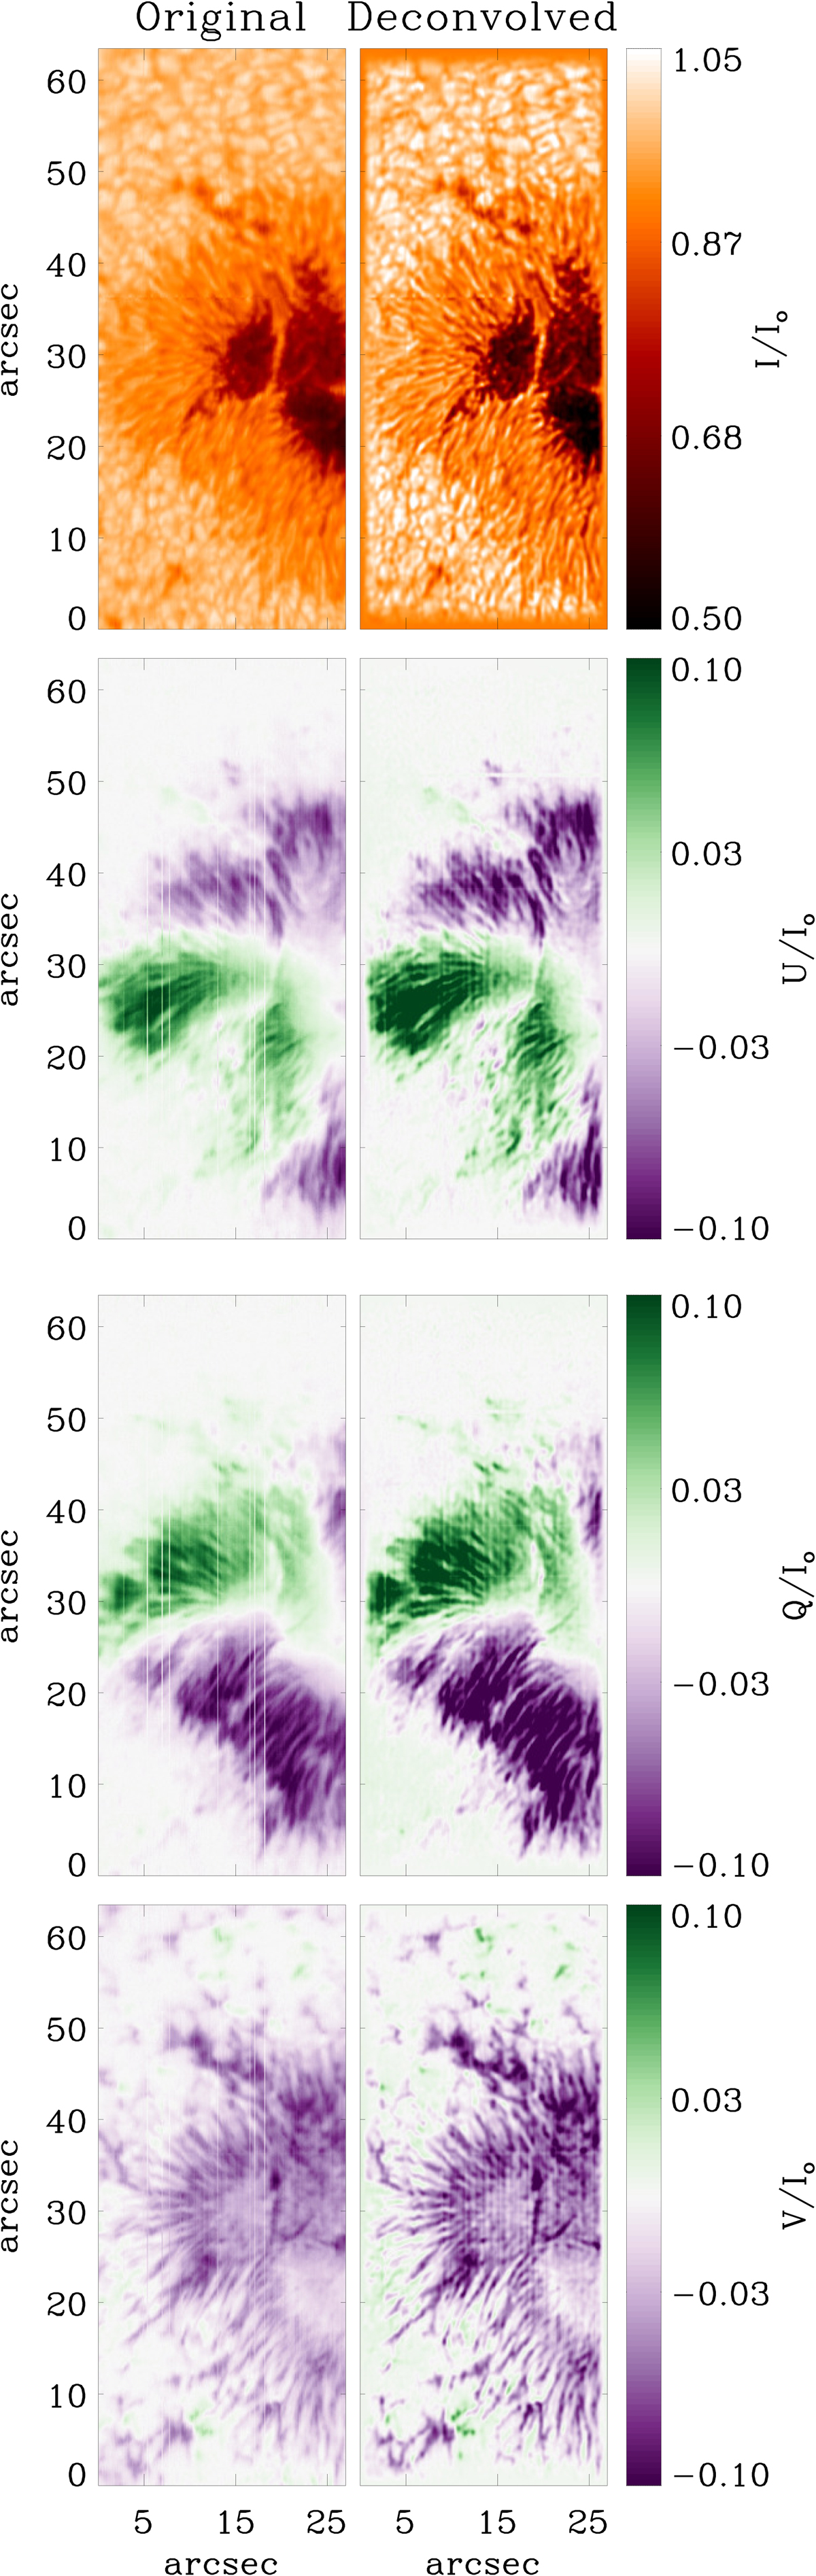
Stokes parameter deconvolution. Each pair of panels is a monochromatic map of the Stokes parameter. From top to bottom: Stokes I at the continuum, Stokes Q and Stokes U both at the core of the line, and finally the Stokes V at the red wing. On the left of each pair, the interpolated original map is shown, and on the right is the same map after the deconvolution.
Current usage metrics show cumulative count of Article Views (full-text article views including HTML views, PDF and ePub downloads, according to the available data) and Abstracts Views on Vision4Press platform.
Data correspond to usage on the plateform after 2015. The current usage metrics is available 48-96 hours after online publication and is updated daily on week days.
Initial download of the metrics may take a while.