Free Access
Fig. 2.
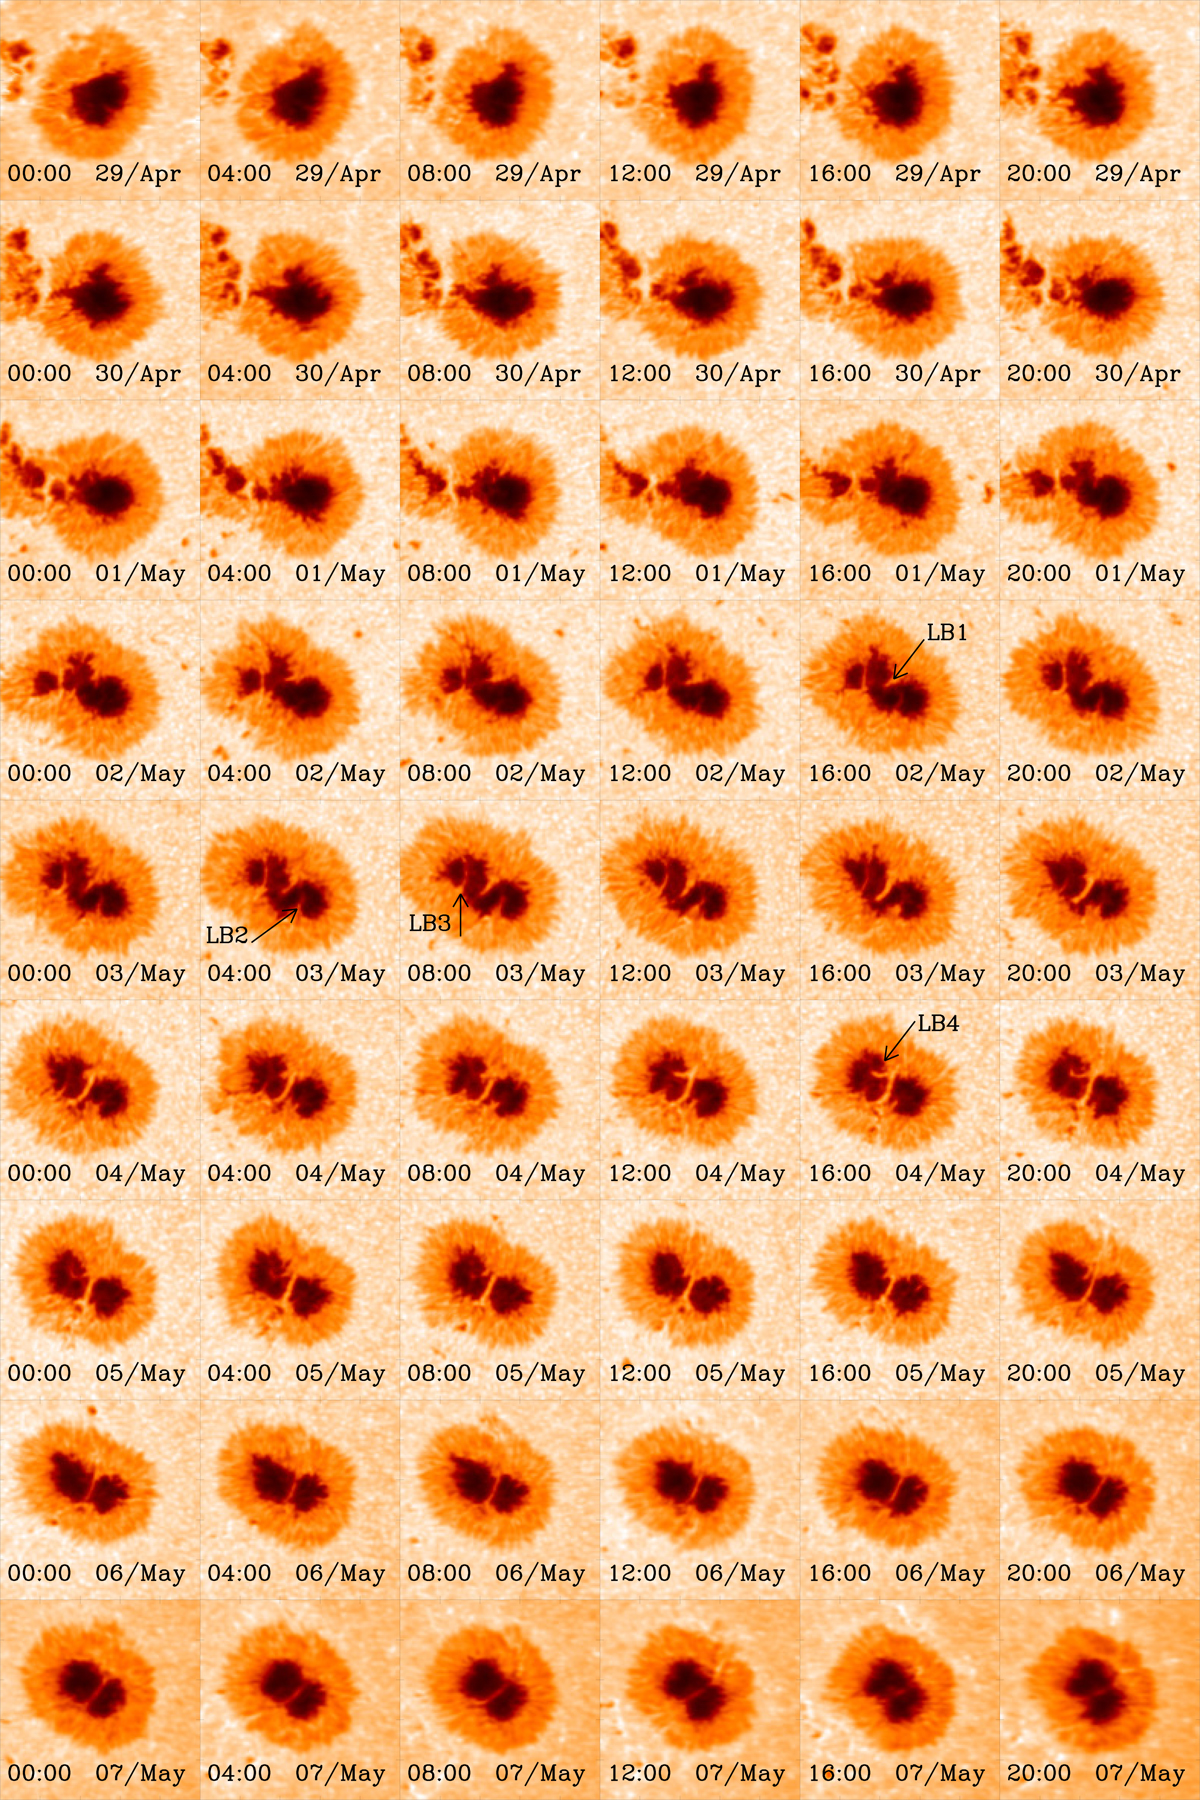
Temporal evolution of the intensity maps of the leading sunspot of NOAA active region 12049 observed with the HMI instrument. There are four main LBs labelled LB1, LB2, LB3, and LB4, which evolve in different ways. The first three LBs are analysed in this work.
Current usage metrics show cumulative count of Article Views (full-text article views including HTML views, PDF and ePub downloads, according to the available data) and Abstracts Views on Vision4Press platform.
Data correspond to usage on the plateform after 2015. The current usage metrics is available 48-96 hours after online publication and is updated daily on week days.
Initial download of the metrics may take a while.