Fig. 18.
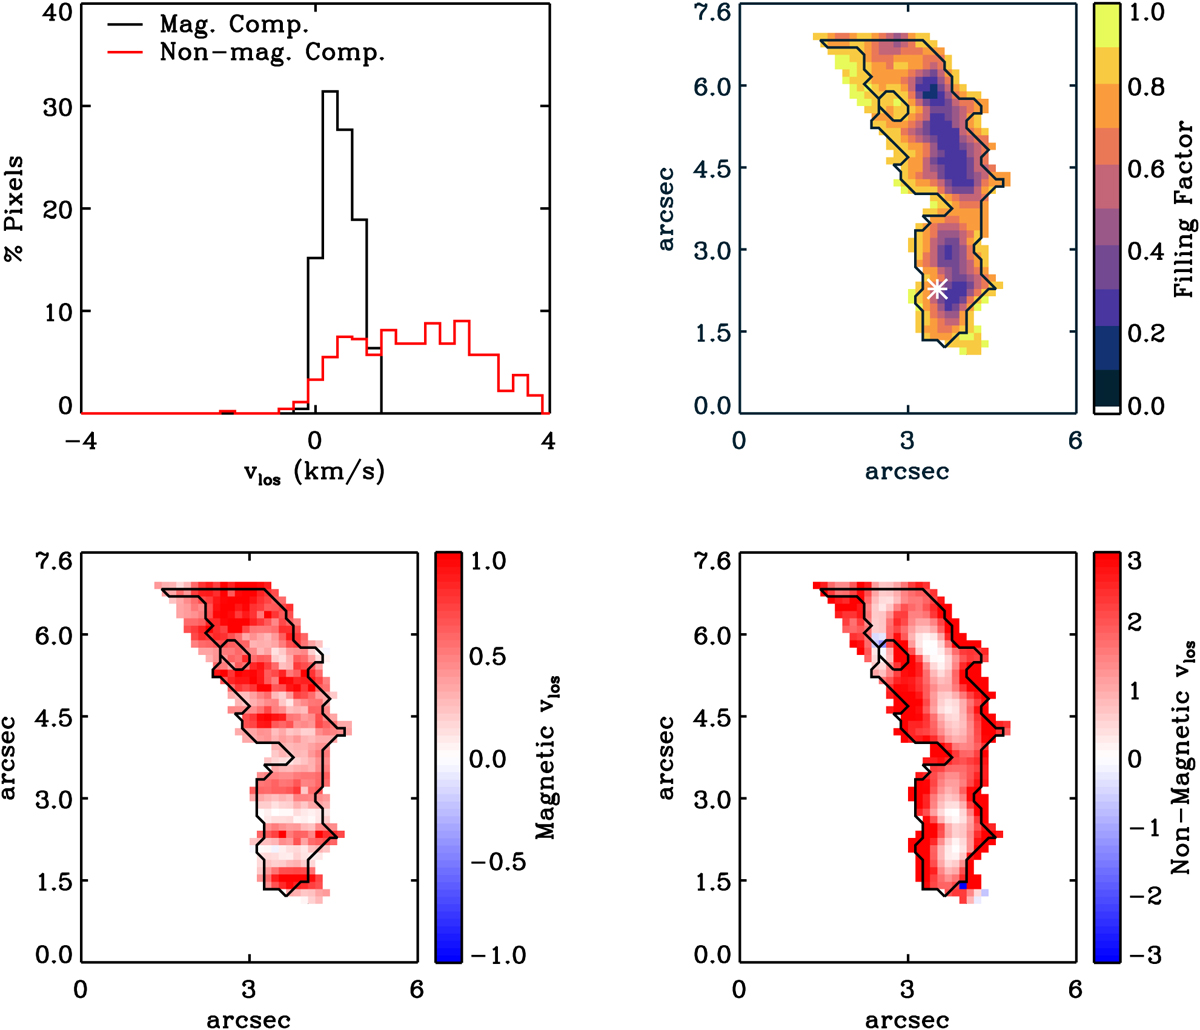
Comparison between magnetic and non-magnetic depth-averaged velocities of LB1 in Scan 3_05. The histogram shows the distributions of ![]() (black line) and
(black line) and ![]() (red line). Upper right panel: ff, and the white asterisk indicates the pixel taken to analyse the Stokes I and V profiles in Fig. B.2. Lower panels:
(red line). Upper right panel: ff, and the white asterisk indicates the pixel taken to analyse the Stokes I and V profiles in Fig. B.2. Lower panels: ![]() on the left and
on the left and ![]() on the right. The black contours of the maps enclose the area with ff below 85%.
on the right. The black contours of the maps enclose the area with ff below 85%.
Current usage metrics show cumulative count of Article Views (full-text article views including HTML views, PDF and ePub downloads, according to the available data) and Abstracts Views on Vision4Press platform.
Data correspond to usage on the plateform after 2015. The current usage metrics is available 48-96 hours after online publication and is updated daily on week days.
Initial download of the metrics may take a while.