Free Access
Fig. 14.
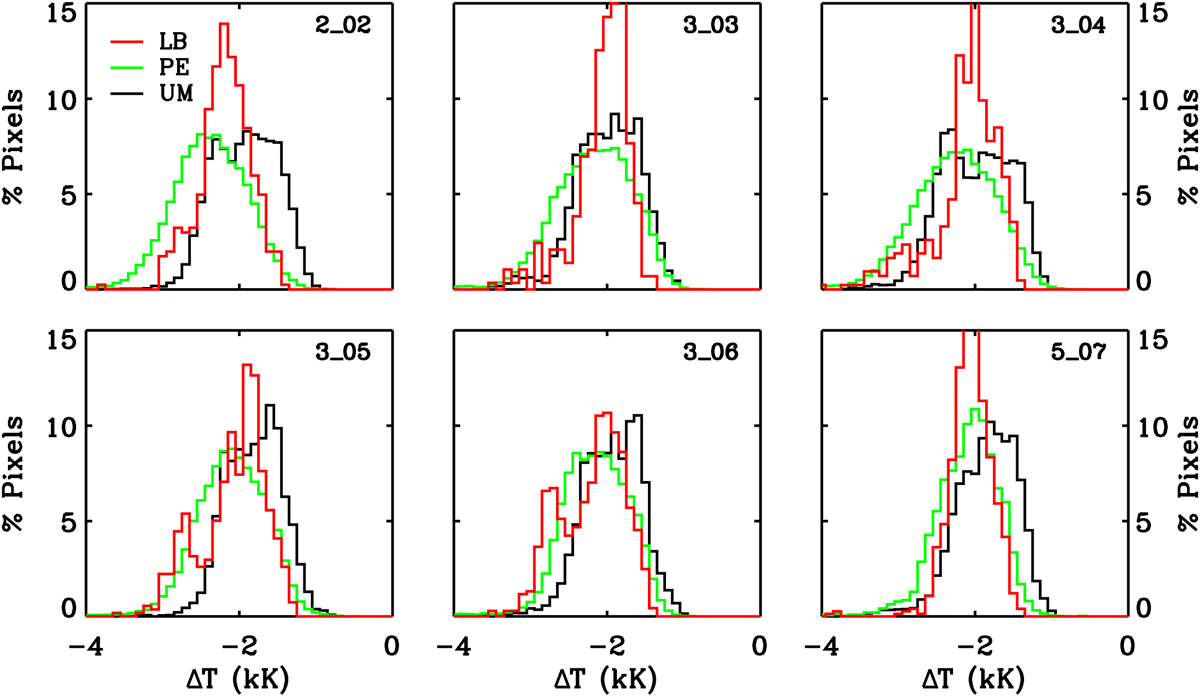
Distribution of the difference between the average temperature in the upper and lower layers of LB1 (ΔT = Tupper − Tlower). The red line corresponds to the LB distribution. The penumbral is shown in green and the umbral distribution in black.
Current usage metrics show cumulative count of Article Views (full-text article views including HTML views, PDF and ePub downloads, according to the available data) and Abstracts Views on Vision4Press platform.
Data correspond to usage on the plateform after 2015. The current usage metrics is available 48-96 hours after online publication and is updated daily on week days.
Initial download of the metrics may take a while.