Fig. 10.
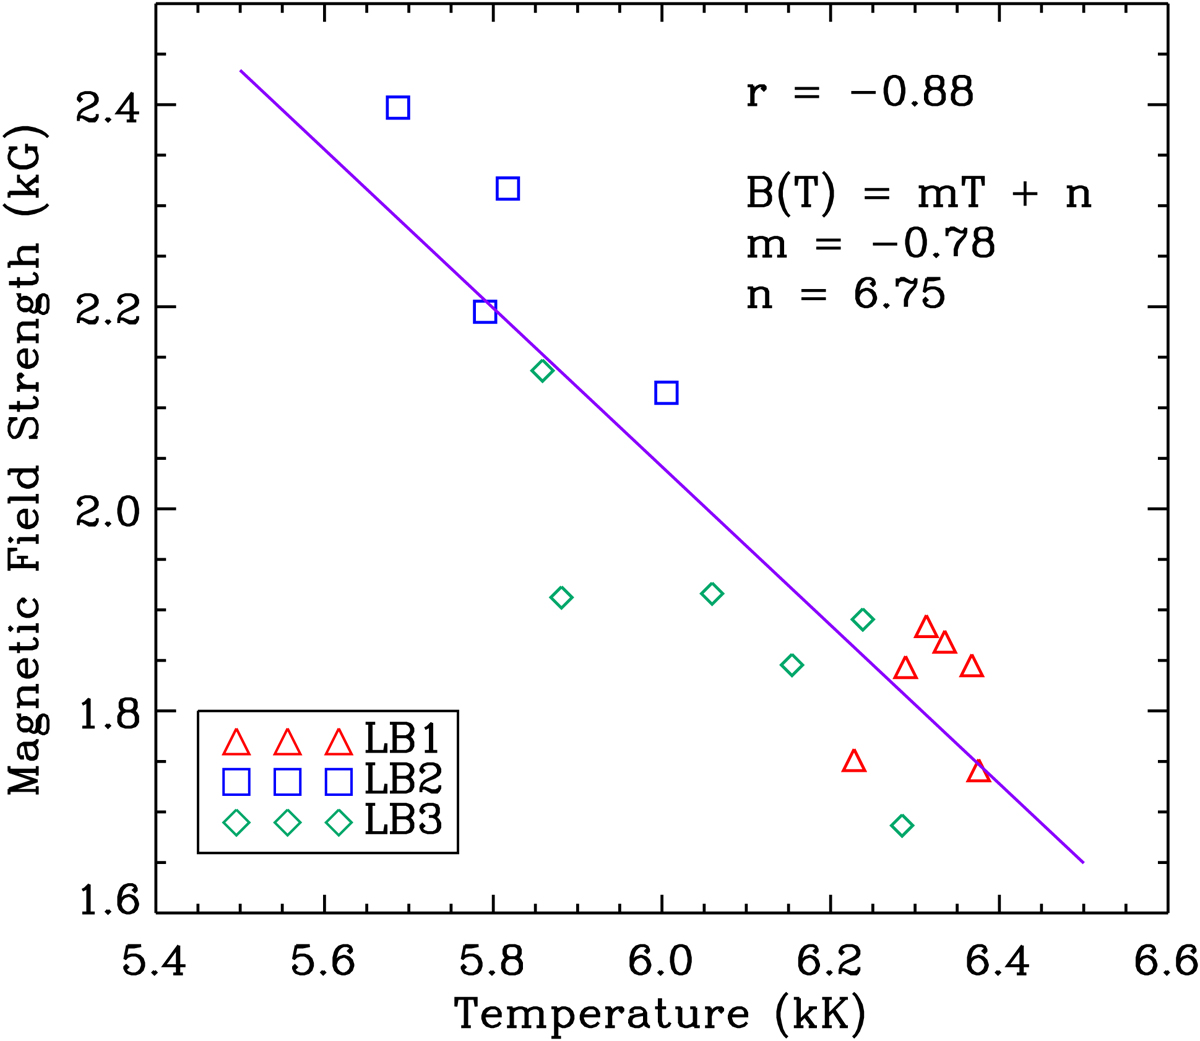
Relation between the magnetic field strength and the temperature for the three LBs. The red triangles, blue squares, and green diamonds correspond to the values for LB1, LB2, and LB3, respectively. The purple line represents the linear fit of the values whose equation is written on the right of the graph. The r value corresponds to the Pearson correlation coefficient.
Current usage metrics show cumulative count of Article Views (full-text article views including HTML views, PDF and ePub downloads, according to the available data) and Abstracts Views on Vision4Press platform.
Data correspond to usage on the plateform after 2015. The current usage metrics is available 48-96 hours after online publication and is updated daily on week days.
Initial download of the metrics may take a while.