Fig. 4.
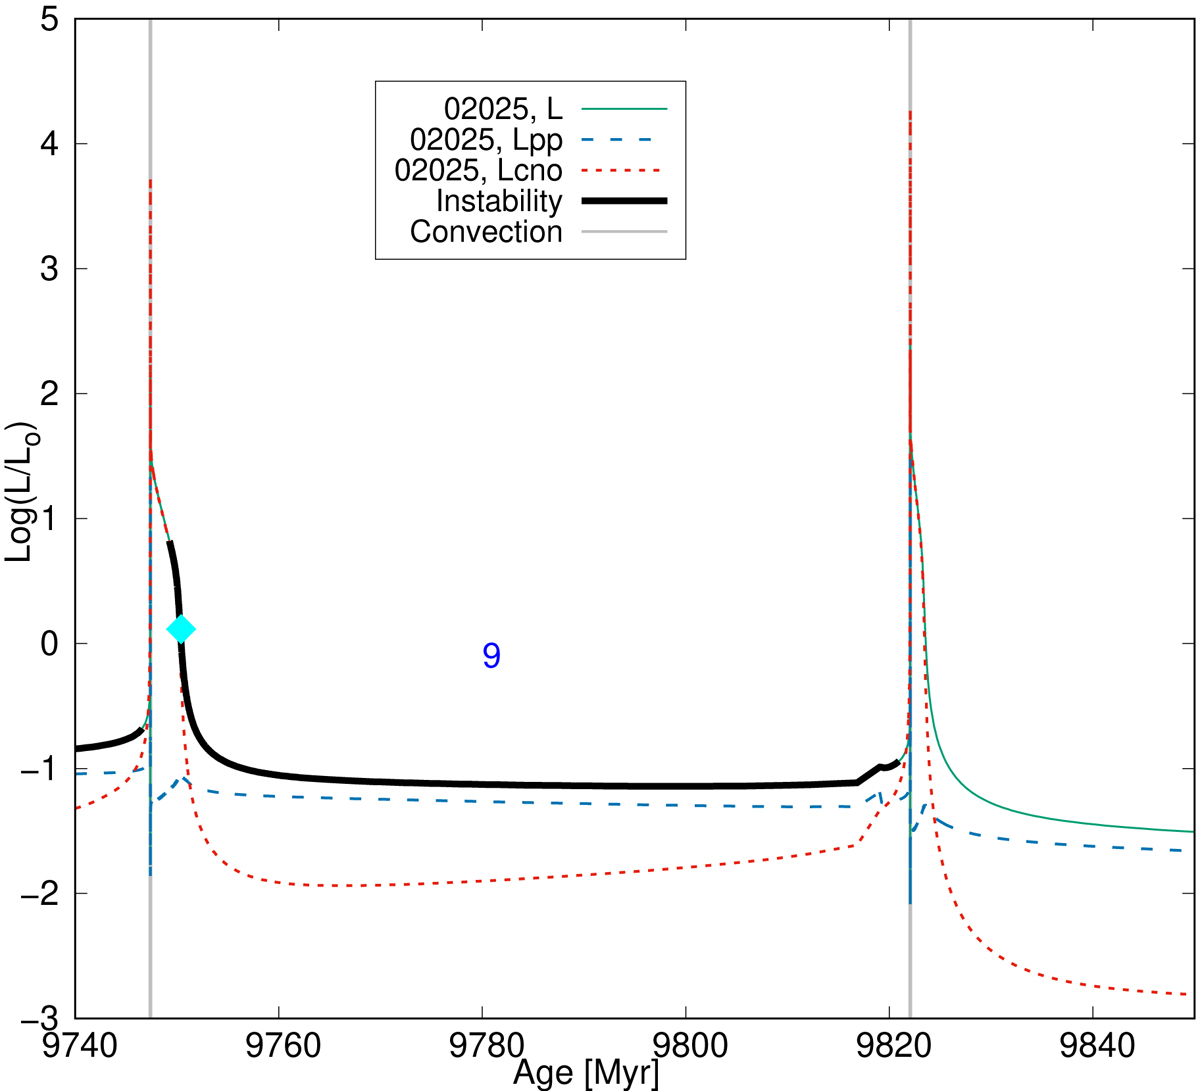
log(L/L⊙) vs. age (in Myr) for the sequence with 0.2025 M⊙, corresponding to the last instability region. The temporal evolution of the surface luminosity (green line), the luminosity given by the pp chain (light-blue dashed line), and the luminosity due to the CNO bicycle (red dotted line) are shown, along with the ninth instability region emphasized by a thick black line. Grey vertical strips mark the narrow regions where convection is present (either internal or external). A blue number indicates the number of the flash (as in Fig. 1), while the cyan diamond indicates the location of the template model analyzed in Fig. 5 (and Fig. 1).
Current usage metrics show cumulative count of Article Views (full-text article views including HTML views, PDF and ePub downloads, according to the available data) and Abstracts Views on Vision4Press platform.
Data correspond to usage on the plateform after 2015. The current usage metrics is available 48-96 hours after online publication and is updated daily on week days.
Initial download of the metrics may take a while.