Fig. 2.
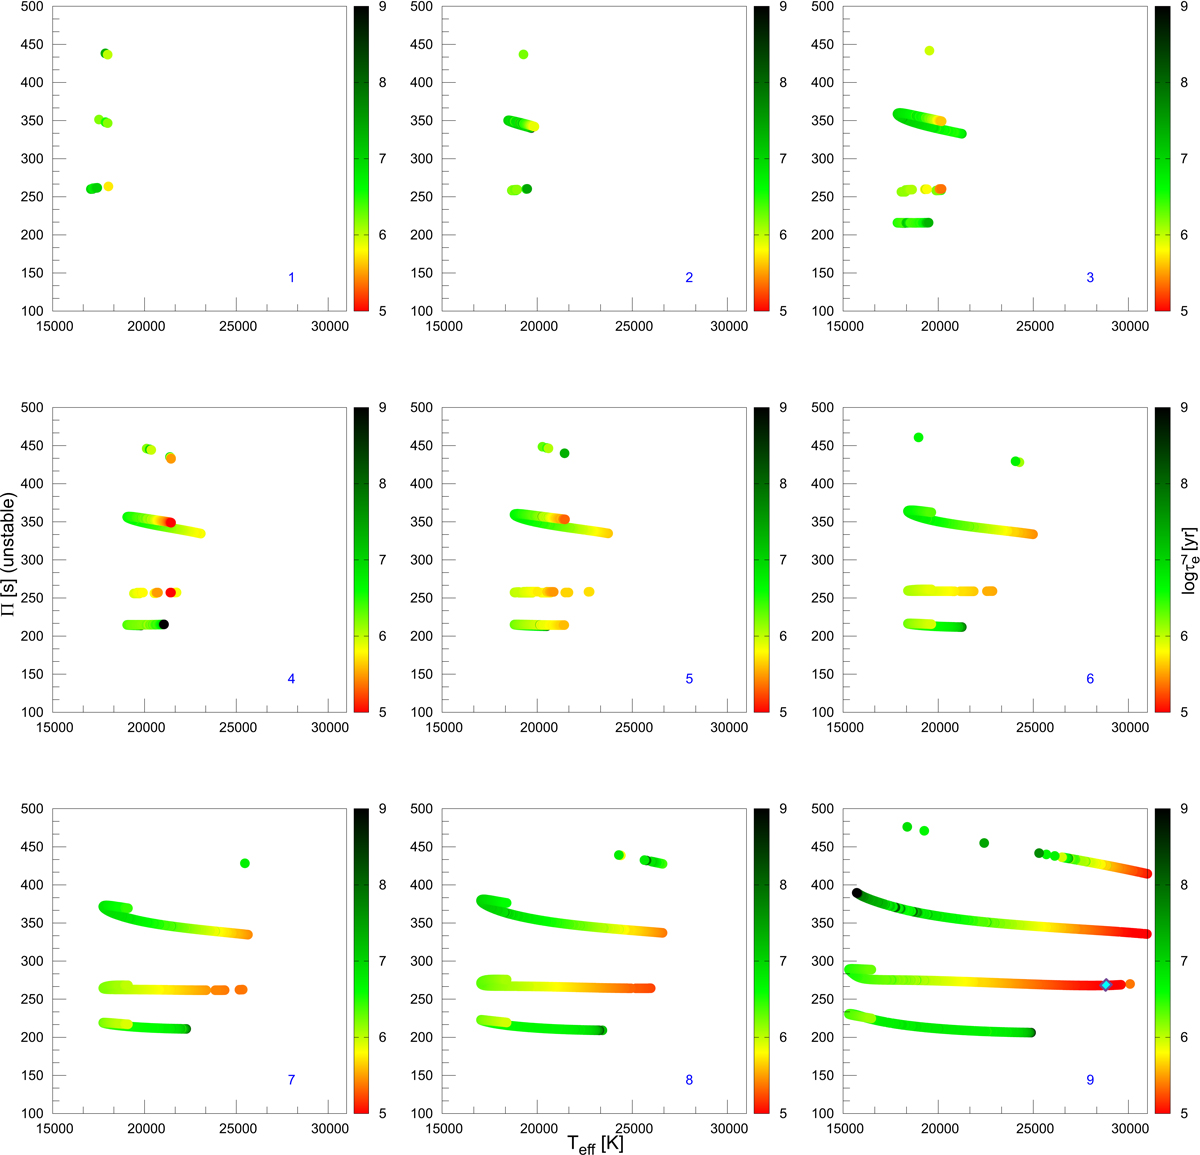
Periods of unstable ℓ = 1 g modes in terms of the effective temperature for the nine flashes experimented by our template low-mass sequence with 0.2025 M⊙. Color coding indicates the logarithm of the e-folding time (τe) of each unstable mode (right scale). Blue numbers at the bottom right corner of each panel indicate the number of the flash, as in Fig. 1. The cyan diamond on the bottom right panel indicates the location of the template model analyzed in Fig. 5 (as in Fig. 1).
Current usage metrics show cumulative count of Article Views (full-text article views including HTML views, PDF and ePub downloads, according to the available data) and Abstracts Views on Vision4Press platform.
Data correspond to usage on the plateform after 2015. The current usage metrics is available 48-96 hours after online publication and is updated daily on week days.
Initial download of the metrics may take a while.