Fig. 1.
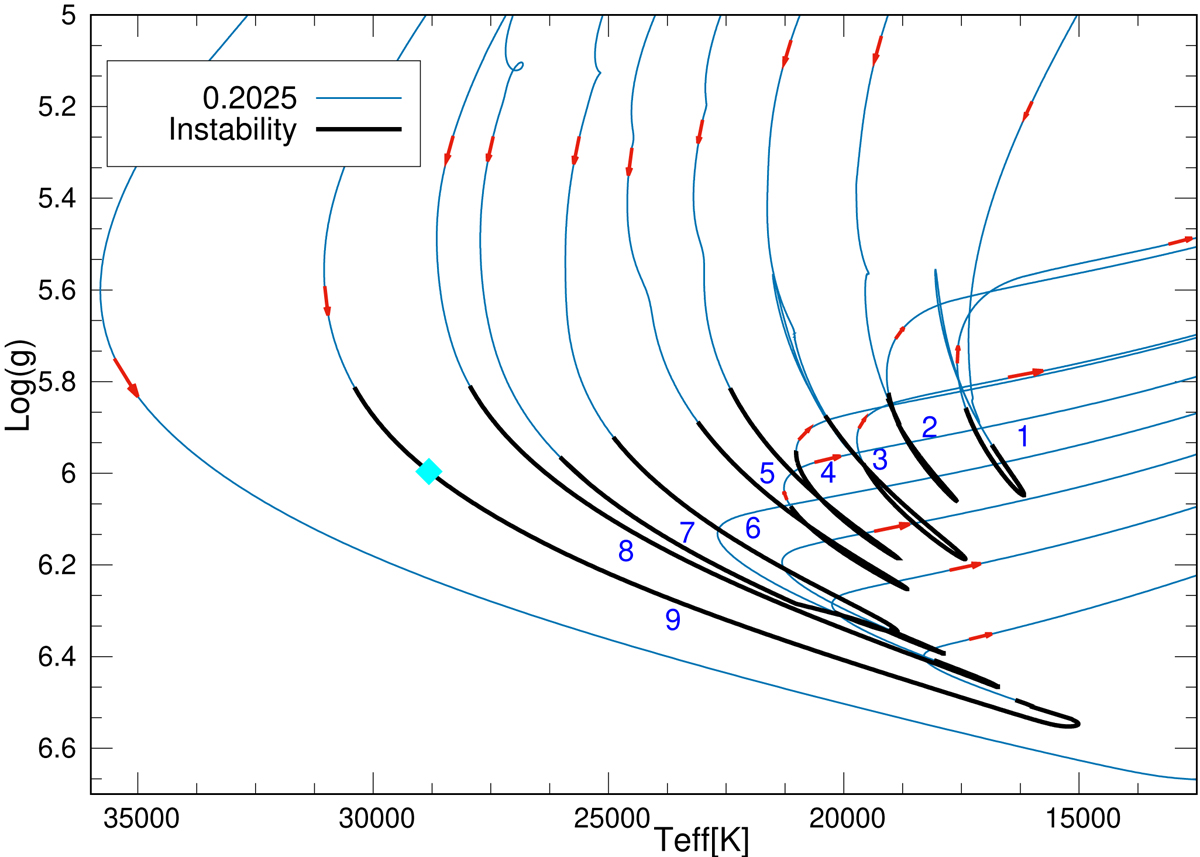
Instability domain corresponding to the ε mechanism on the log g vs. Teff diagram for the low-mass WD sequence with 0.2025 M⊙. The stages of pulsational instability are emphasized with thick black lines along the evolutionary tracks. Low-order g modes are driven before each flash. The track begins after the end of Roche-lobe overflow (upper right branch of the curve) and proceeds downward, toward higher values of Teff, until the first CNO flash takes place. Numbers denote every consecutive flash. Red arrows along the curve indicate the course of the evolution. The cyan diamond before the ninth flash indicates the location of the template model analyzed in Fig. 5.
Current usage metrics show cumulative count of Article Views (full-text article views including HTML views, PDF and ePub downloads, according to the available data) and Abstracts Views on Vision4Press platform.
Data correspond to usage on the plateform after 2015. The current usage metrics is available 48-96 hours after online publication and is updated daily on week days.
Initial download of the metrics may take a while.