Fig. 8.
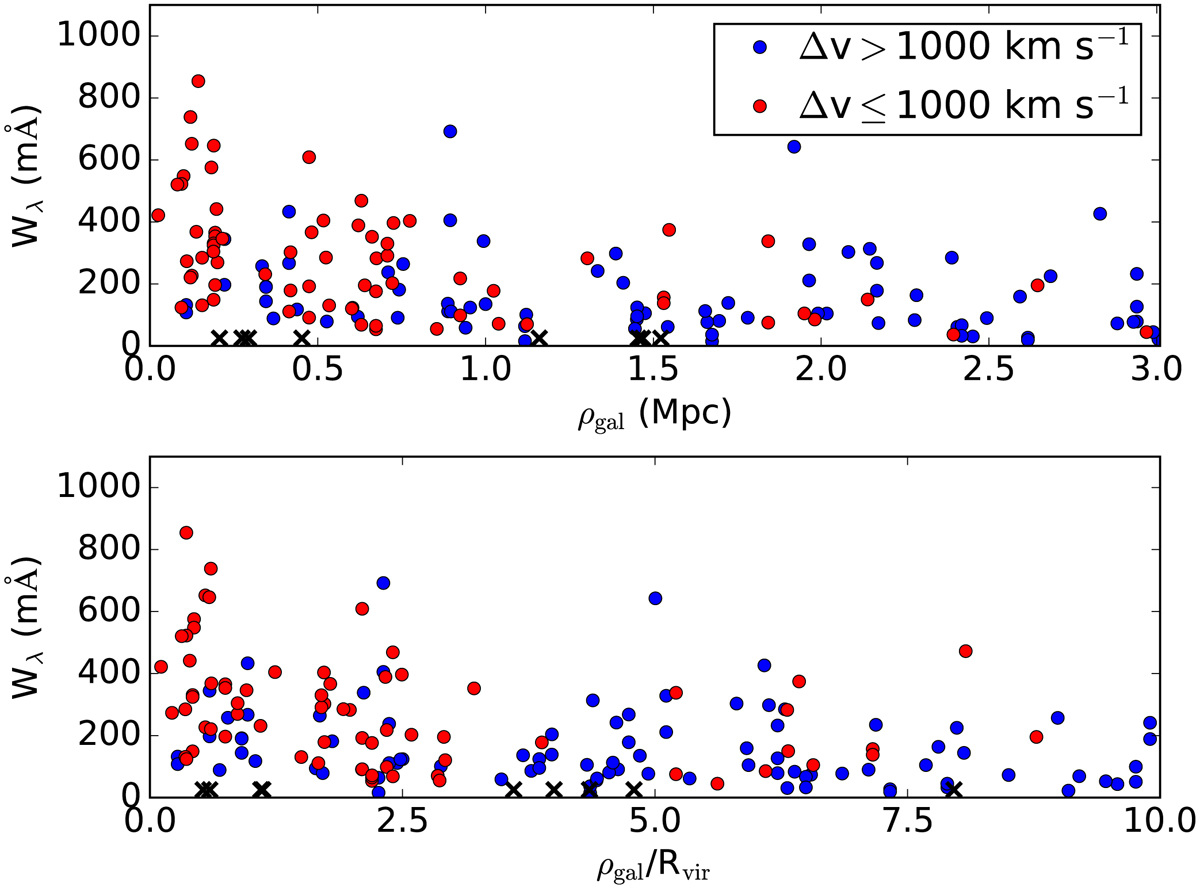
Equivalent width of Lyα absorbers (blue dots) plotted against the impact parameter to the nearest galaxy (upper panel) or against the impact parameter in units of the galaxy’s virial radius (lower panel). The sample has been split into components that lie within 1000 km s−1 of the nearest filament segment (red) and components that have a larger velocity difference (blue). Black crosses indicate sightlines that exhibit no significant Lyα absorption in the analysed spectral region. For these, we give the distance to the nearest galaxy in the velocity range v = 1070 − 6700 km s−1.
Current usage metrics show cumulative count of Article Views (full-text article views including HTML views, PDF and ePub downloads, according to the available data) and Abstracts Views on Vision4Press platform.
Data correspond to usage on the plateform after 2015. The current usage metrics is available 48-96 hours after online publication and is updated daily on week days.
Initial download of the metrics may take a while.