Free Access
Fig. 3.
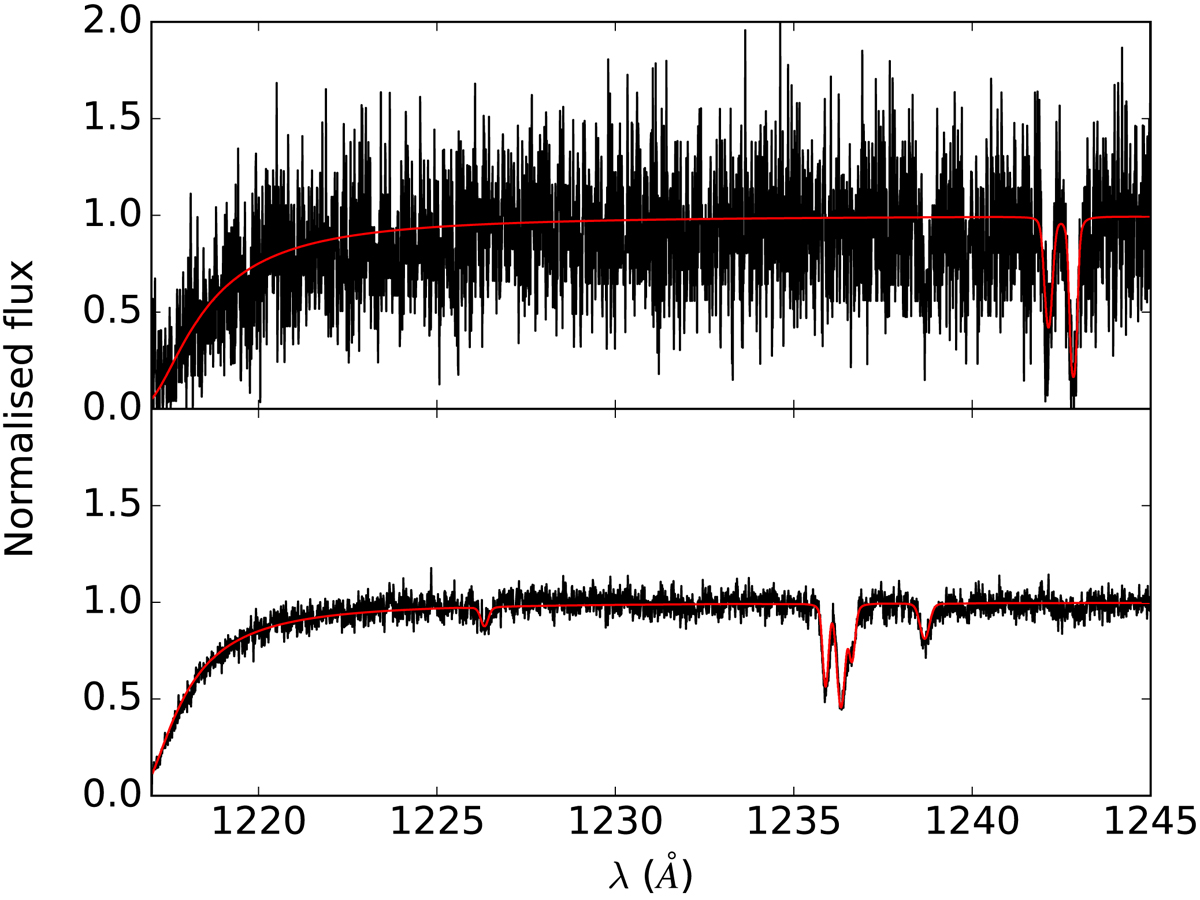
HST/COS G130M spectra of the QSOs VV2006−J131545.2+152556 (upper panel) and PKS2155−304 (lower panel). The COS data are given in black, and the absorber model is plotted in red. Several Lyα absorbers are seen in these spectra. For a better visualisation, both spectra are binned over two pixels.
Current usage metrics show cumulative count of Article Views (full-text article views including HTML views, PDF and ePub downloads, according to the available data) and Abstracts Views on Vision4Press platform.
Data correspond to usage on the plateform after 2015. The current usage metrics is available 48-96 hours after online publication and is updated daily on week days.
Initial download of the metrics may take a while.