Fig. 2.
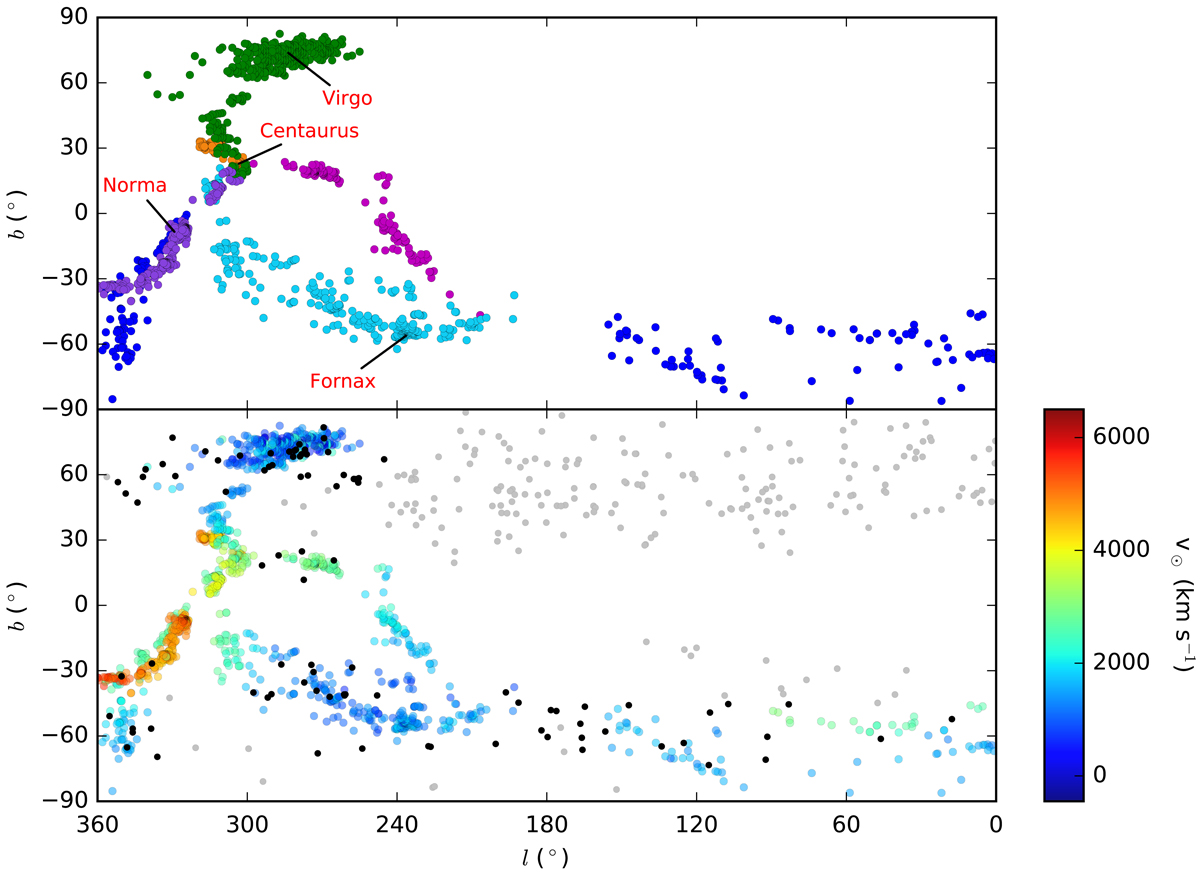
All-sky map of filaments in the local Universe. Upper panel: sky distribution of galaxies from V8k belonging to filaments as defined in Courtois et al. (2013). The different colours indicate different galaxy filaments. Several important clusters are noted. Lower panel: sky distribution of HST/COS sightlines passing close to a filament (black circles) and HST/COS sightlines not belonging to a filament (grey circles) plotted together with the galaxies from the V8k catalogue belonging to filaments (colour-coded according to velocity).
Current usage metrics show cumulative count of Article Views (full-text article views including HTML views, PDF and ePub downloads, according to the available data) and Abstracts Views on Vision4Press platform.
Data correspond to usage on the plateform after 2015. The current usage metrics is available 48-96 hours after online publication and is updated daily on week days.
Initial download of the metrics may take a while.