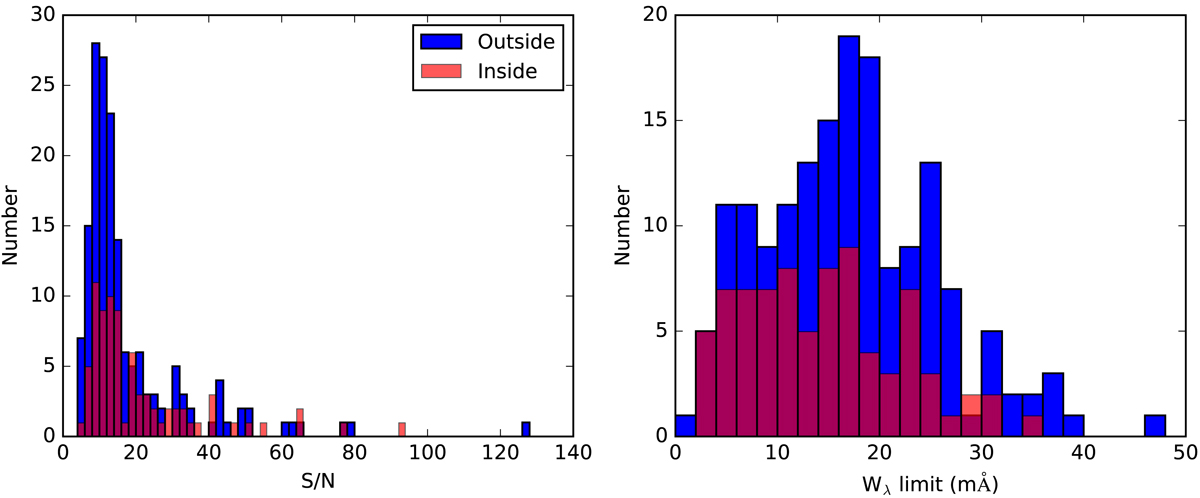
Fig. A.1.

Information on the S/N of the COS spectra used in this study. Left panel: distribution of the measured S/N per resolution element near Å 1240 for the COS spectra that are filament-related and those outside of filaments. Right panel: formal 3σ detection limits for H I Ly α absorption in these spectra, based on the equation given in Tumlinson et al. (2002). We note that these values reflect the detectability of Ly α absorption as a function of the local S/N under idealised conditions (no blending, no fixed-pattern noise, perfectly known continuum flux).
Current usage metrics show cumulative count of Article Views (full-text article views including HTML views, PDF and ePub downloads, according to the available data) and Abstracts Views on Vision4Press platform.
Data correspond to usage on the plateform after 2015. The current usage metrics is available 48-96 hours after online publication and is updated daily on week days.
Initial download of the metrics may take a while.


