Fig. 17.
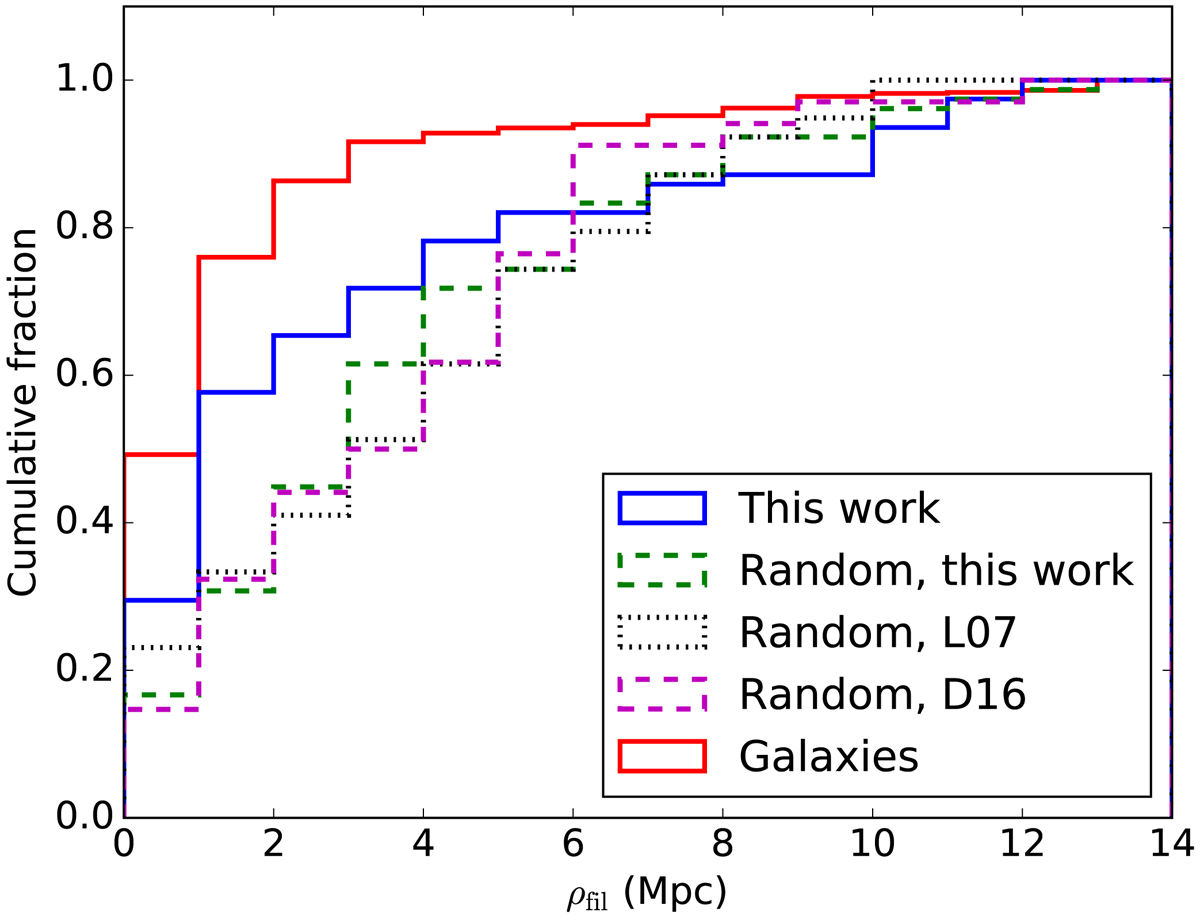
Cumulative distribution function for ρfil for three different absorber samples. The measured absorbers in the COS data are indicated in blue, the random sample with its own statistics is plotted in dashed green, the random sample with the L07 statistics is indicated in dotted black, and the random sample from Danforth et al. (2016) is added in dashed magenta (D16). The distribution for the galaxies is shown in red.
Current usage metrics show cumulative count of Article Views (full-text article views including HTML views, PDF and ePub downloads, according to the available data) and Abstracts Views on Vision4Press platform.
Data correspond to usage on the plateform after 2015. The current usage metrics is available 48-96 hours after online publication and is updated daily on week days.
Initial download of the metrics may take a while.