Fig. 12.
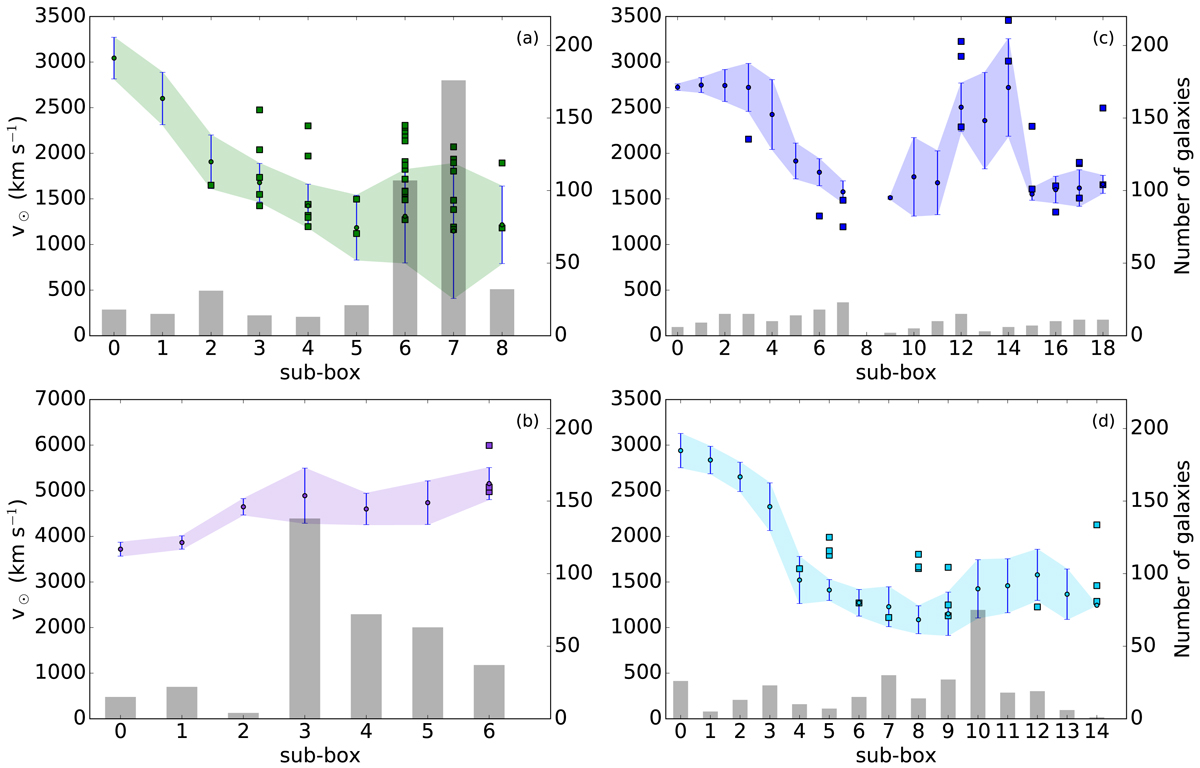
Average galaxy velocities along four filaments (dots) – (a): green; (b): purple; (c): dark blue; (d): cyan – plotted together with the velocities of Lyα absorbers (squares) for each sub-box (segment). The velocity dispersion is indicated by the colour-shaded area. The grey bars indicate the numbers of galaxies belonging to each sub-box (segment) in the filament.
Current usage metrics show cumulative count of Article Views (full-text article views including HTML views, PDF and ePub downloads, according to the available data) and Abstracts Views on Vision4Press platform.
Data correspond to usage on the plateform after 2015. The current usage metrics is available 48-96 hours after online publication and is updated daily on week days.
Initial download of the metrics may take a while.