Fig. 3
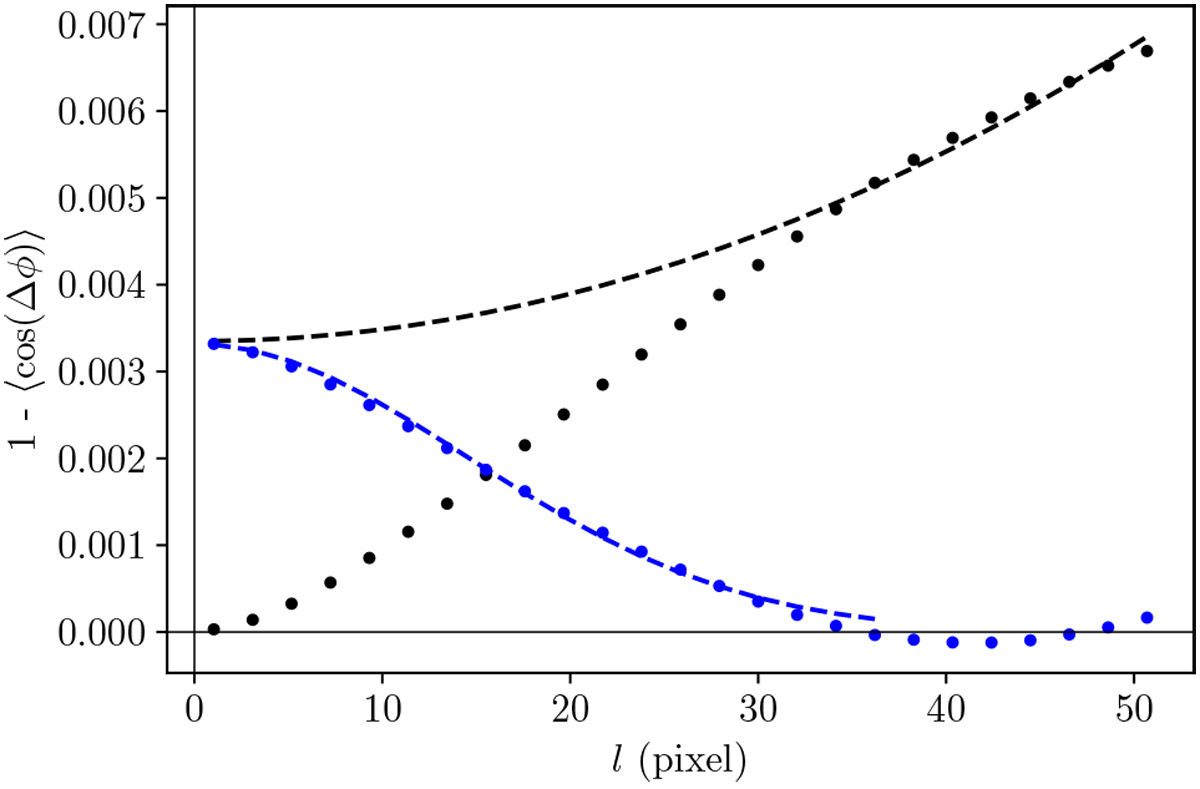
Dispersion function of the synthetic polarization map. Black dots correspond to the dispersion function computed using Eq. (15) for the Ms = 0.7 model. The model fit at large scales is shown with the broken dashed curve. Blue points mark the dispersion function subtracted with the dashed black line, and the blue line shows the fit of Eq. (23).
Current usage metrics show cumulative count of Article Views (full-text article views including HTML views, PDF and ePub downloads, according to the available data) and Abstracts Views on Vision4Press platform.
Data correspond to usage on the plateform after 2015. The current usage metrics is available 48-96 hours after online publication and is updated daily on week days.
Initial download of the metrics may take a while.