Fig. 2
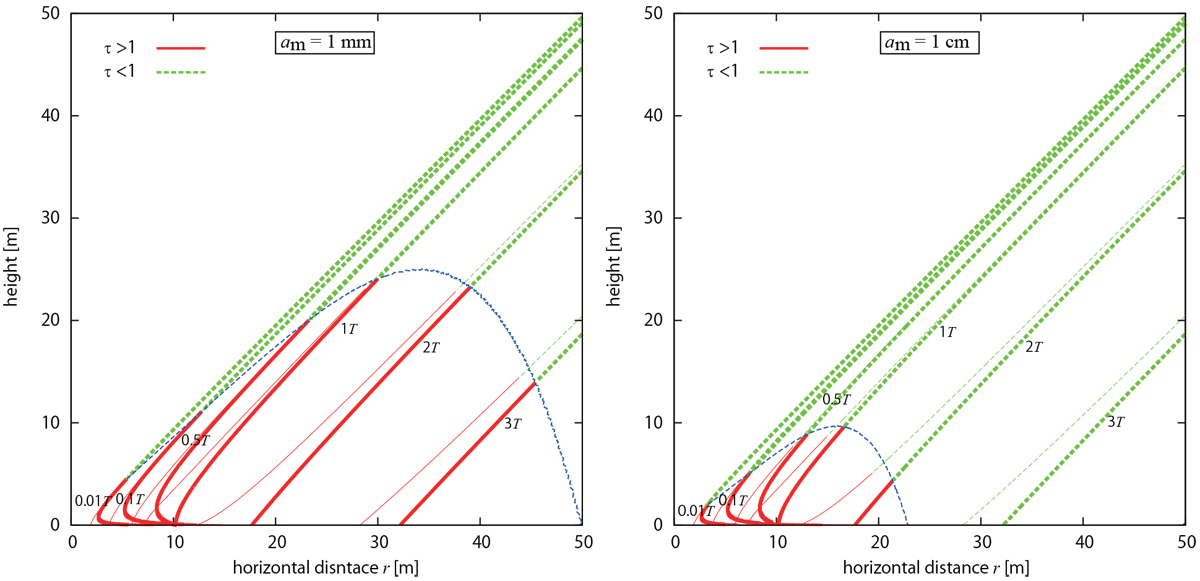
Examples of the evolution model of the ejecta curtain produced by the impact of SCI projectile. Shown is the half cross-sectional view of the ejecta curtain at each time t = 0.01T, 0.1T, 0.5T, 1T, 2T, 3T, where T is the crater formation time. The thick red lines and green dotted lines indicate the front line (area) of the curtain at each time with τ > 1 and τ < 1, respectively.The thin lines indicate the back lines (area) of the curtain. The blue dotted line indicates the trace of the border of τ = 1. The constituent ejecta particles are assumed to have an equal radius am; am = 1 mm (left) and 1 cm (right), respectively. The ejection angle is assumed to be 45 deg.
Current usage metrics show cumulative count of Article Views (full-text article views including HTML views, PDF and ePub downloads, according to the available data) and Abstracts Views on Vision4Press platform.
Data correspond to usage on the plateform after 2015. The current usage metrics is available 48-96 hours after online publication and is updated daily on week days.
Initial download of the metrics may take a while.