Free Access
Fig. 8
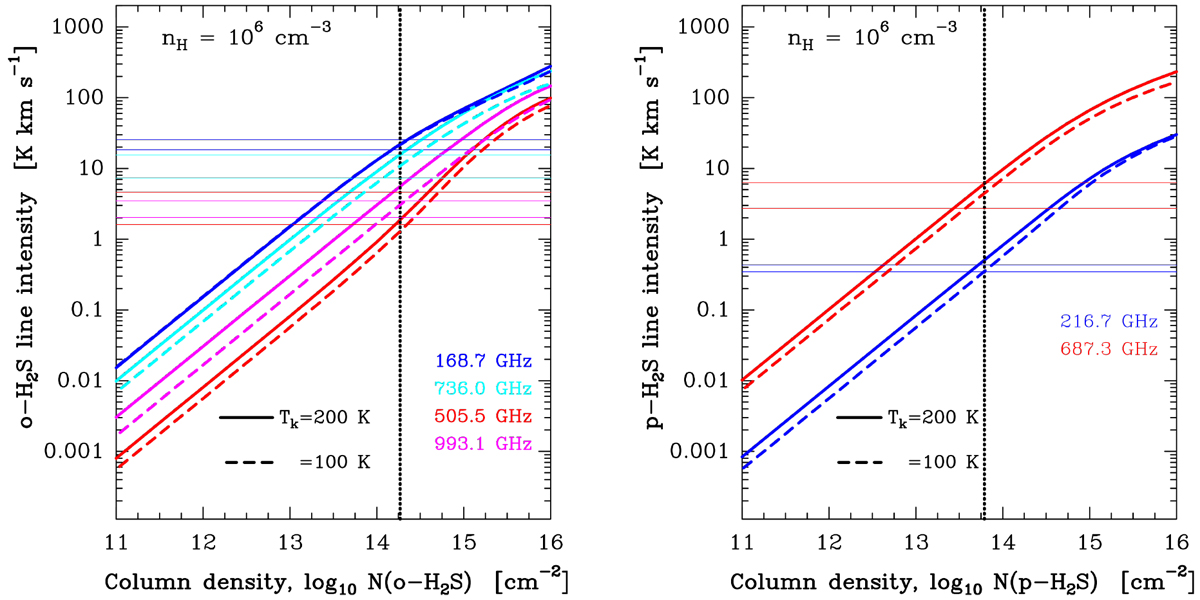
Non-LTE excitation models for o-H2S and p-H2S. Thin horizontal lines show the observed intensities assuming either extended emission (lower limit) or emission that fills the 15″ beam at168.7 GHz. The vertical line marks the best model, resulting in an OTP ratio of 2.9 ± 0.3.
Current usage metrics show cumulative count of Article Views (full-text article views including HTML views, PDF and ePub downloads, according to the available data) and Abstracts Views on Vision4Press platform.
Data correspond to usage on the plateform after 2015. The current usage metrics is available 48-96 hours after online publication and is updated daily on week days.
Initial download of the metrics may take a while.