Free Access
Fig. 7
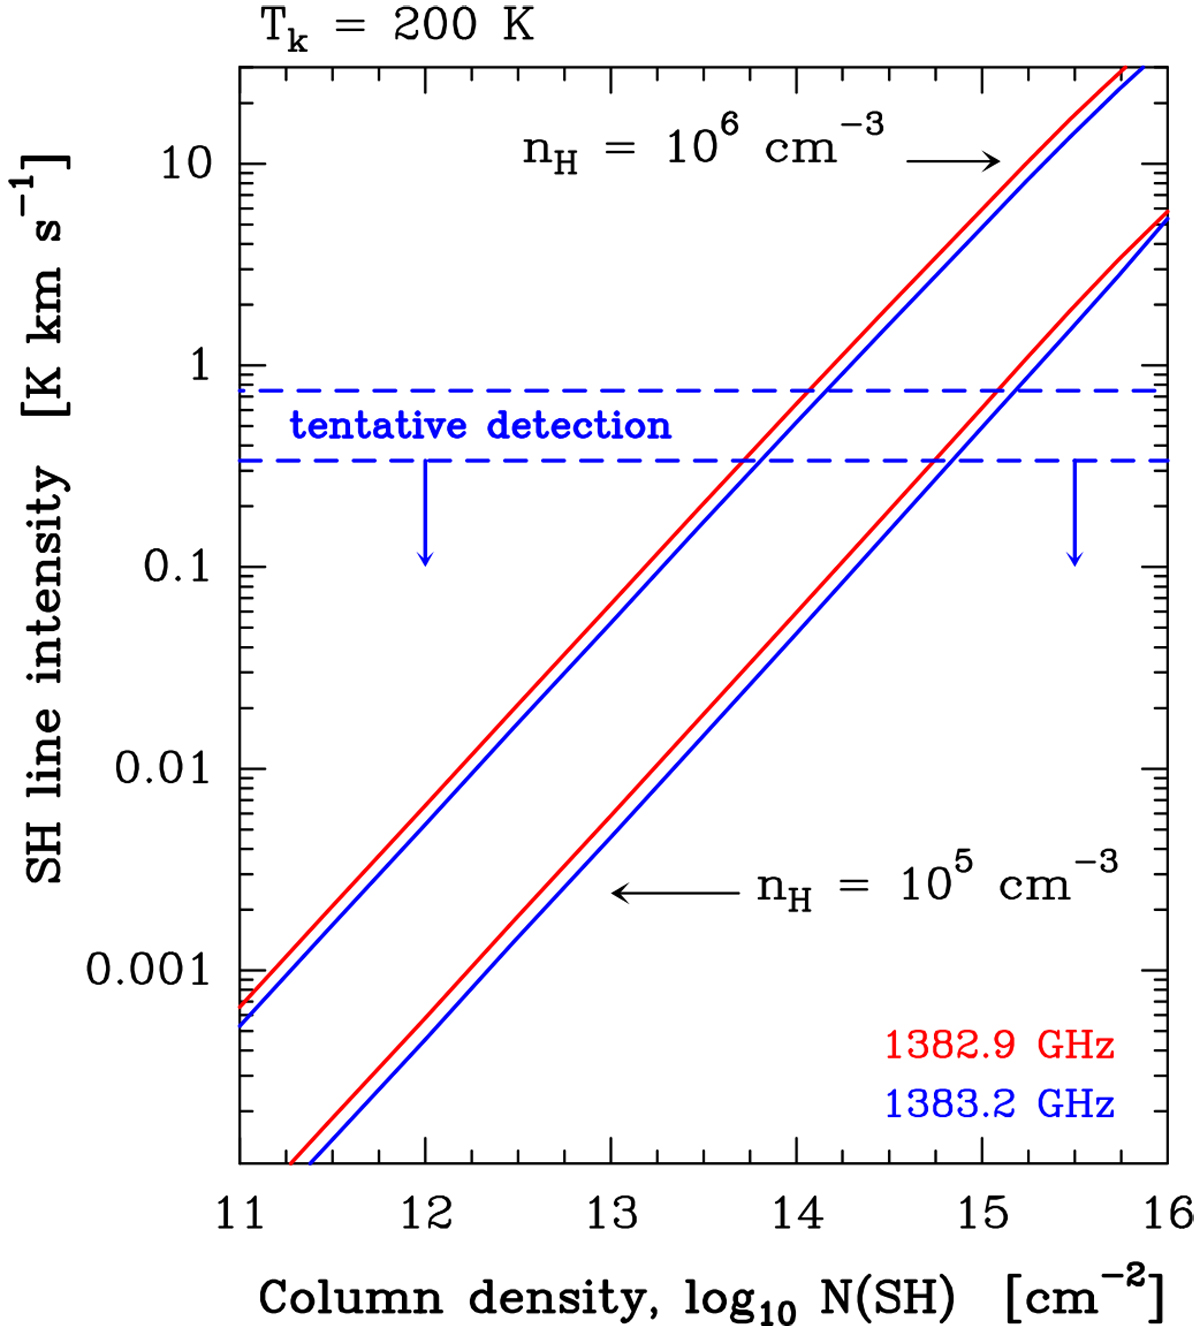
Non-LTE excitation models of SH emission lines targeted with SOFIA/GREAT. Horizontal dashed lines refer to observational limits, assuming extended emission (lower intensities) and for a 10″ width emission filament at the PDR surface (higher intensities).
Current usage metrics show cumulative count of Article Views (full-text article views including HTML views, PDF and ePub downloads, according to the available data) and Abstracts Views on Vision4Press platform.
Data correspond to usage on the plateform after 2015. The current usage metrics is available 48-96 hours after online publication and is updated daily on week days.
Initial download of the metrics may take a while.