Free Access
Fig. 2
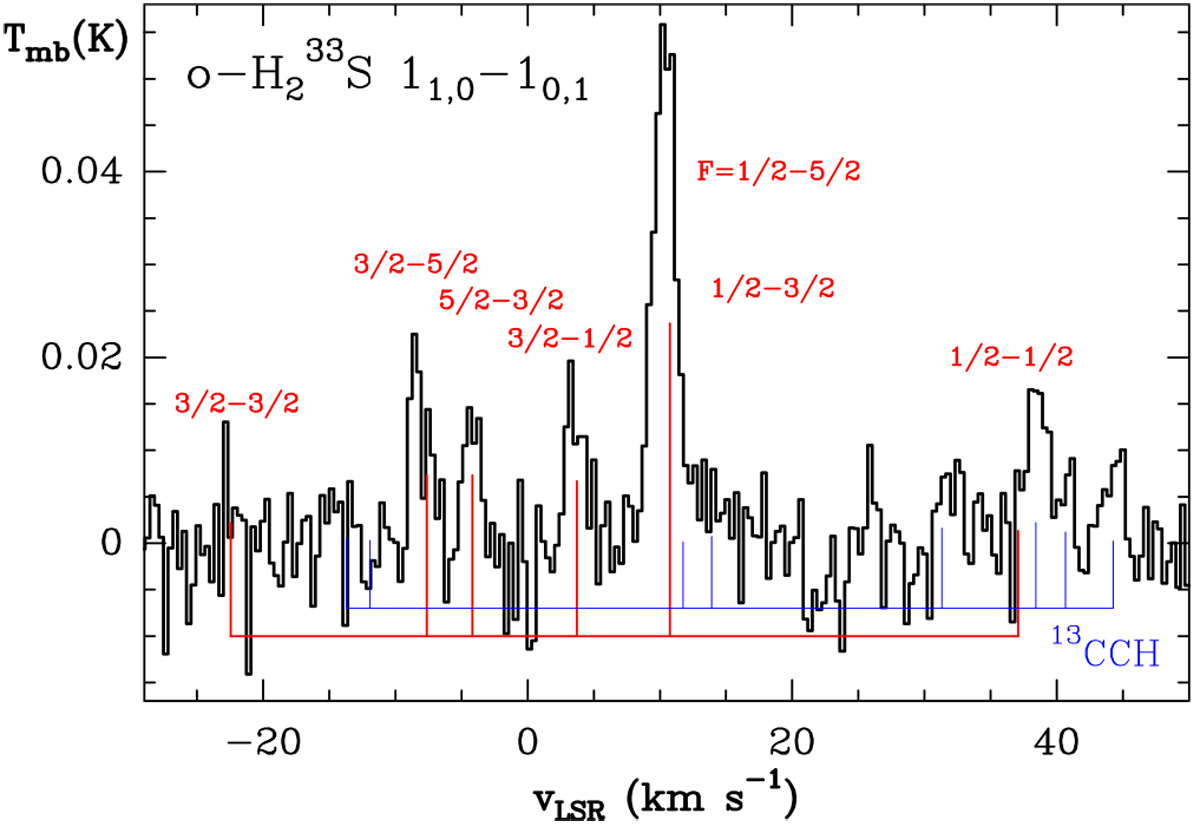
Detection of H2 33 S (at ~168.3 GHz) toward the DF position of the Orion Bar. Red lines indicate hyperfine components. Blue lines show interloping lines from 13CCH. The length of each line is proportional to the transition line strength (taken from the Cologne Database for Molecular Spectroscopy, CDMS; Endres et al. 2016).
Current usage metrics show cumulative count of Article Views (full-text article views including HTML views, PDF and ePub downloads, according to the available data) and Abstracts Views on Vision4Press platform.
Data correspond to usage on the plateform after 2015. The current usage metrics is available 48-96 hours after online publication and is updated daily on week days.
Initial download of the metrics may take a while.