Fig. 15
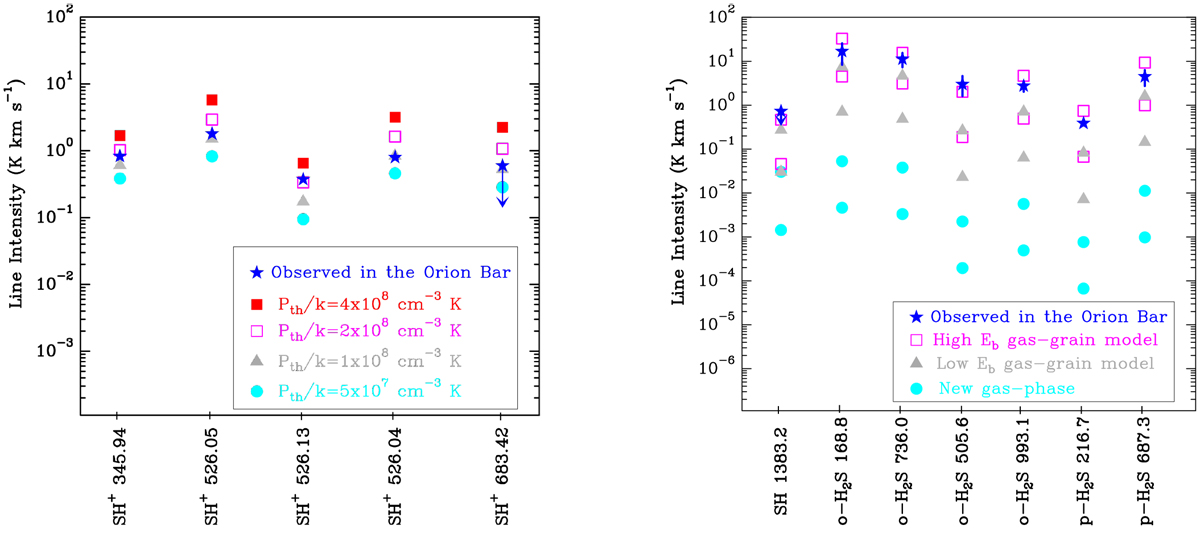
Line intensity predictions for different isobaric PDR models. Calculations were carried out in a multi-slab Monte Carlo code (Sect. 4) that uses the output of the PDR model. Blue stars show the line intensities observed toward the Bar (corrected by beam dilution). Left panel: SH+ emission models for PDRs of different Pth values and α = 5°. Right panel: SH and H2S (adopting anOTP ratio of 3) emission from: high Eb (magenta squares), low Eb (gray triangles), and gas-phase (cyan circles) PDR models, all with Pth / k = 2 × 10⁸ K cm−3. Upper limit intensity predictions are for a PDR with an inclination angle of α = 5° with respectto a edge-on geometry. Lower limit intensities refer to a face-on PDR model.
Current usage metrics show cumulative count of Article Views (full-text article views including HTML views, PDF and ePub downloads, according to the available data) and Abstracts Views on Vision4Press platform.
Data correspond to usage on the plateform after 2015. The current usage metrics is available 48-96 hours after online publication and is updated daily on week days.
Initial download of the metrics may take a while.