Fig. 14
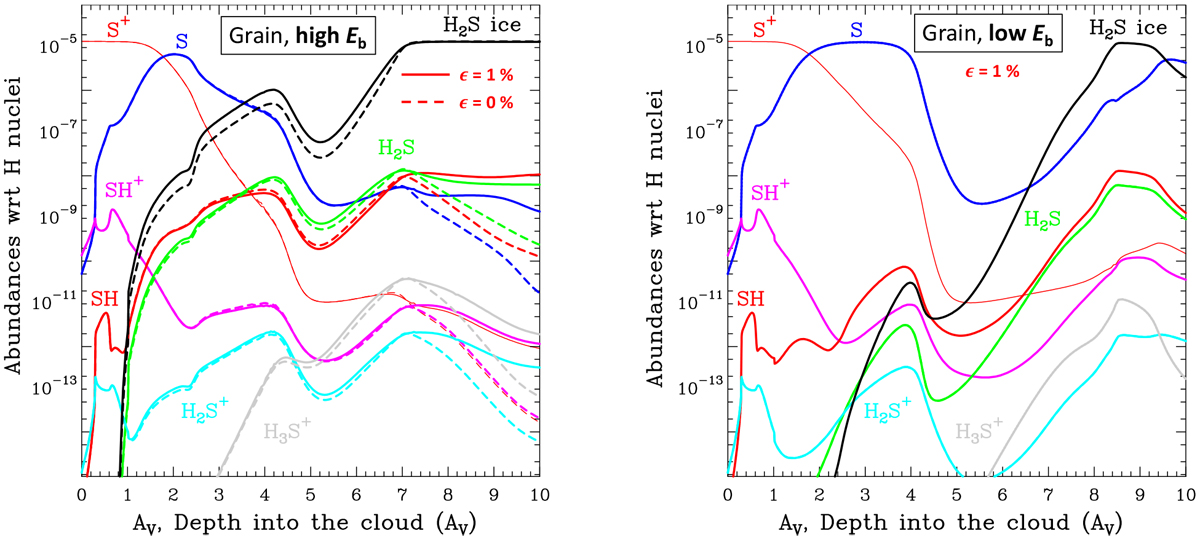
Gas-grain PDR models leading to the formation of s-H2S (shown as black curves). Continuous colored curves show gas-phase fractional abundances as a function of depth into the cloud. ϵ refers to the efficiency of the chemical desorption reaction s-H + s-H2S → SH + H2 (see text). Left panel: gas-grain high Eb model (high adsorption binding energies for S and SH, see Table 4). Right panel: low Eb model.
Current usage metrics show cumulative count of Article Views (full-text article views including HTML views, PDF and ePub downloads, according to the available data) and Abstracts Views on Vision4Press platform.
Data correspond to usage on the plateform after 2015. The current usage metrics is available 48-96 hours after online publication and is updated daily on week days.
Initial download of the metrics may take a while.