Fig. 13
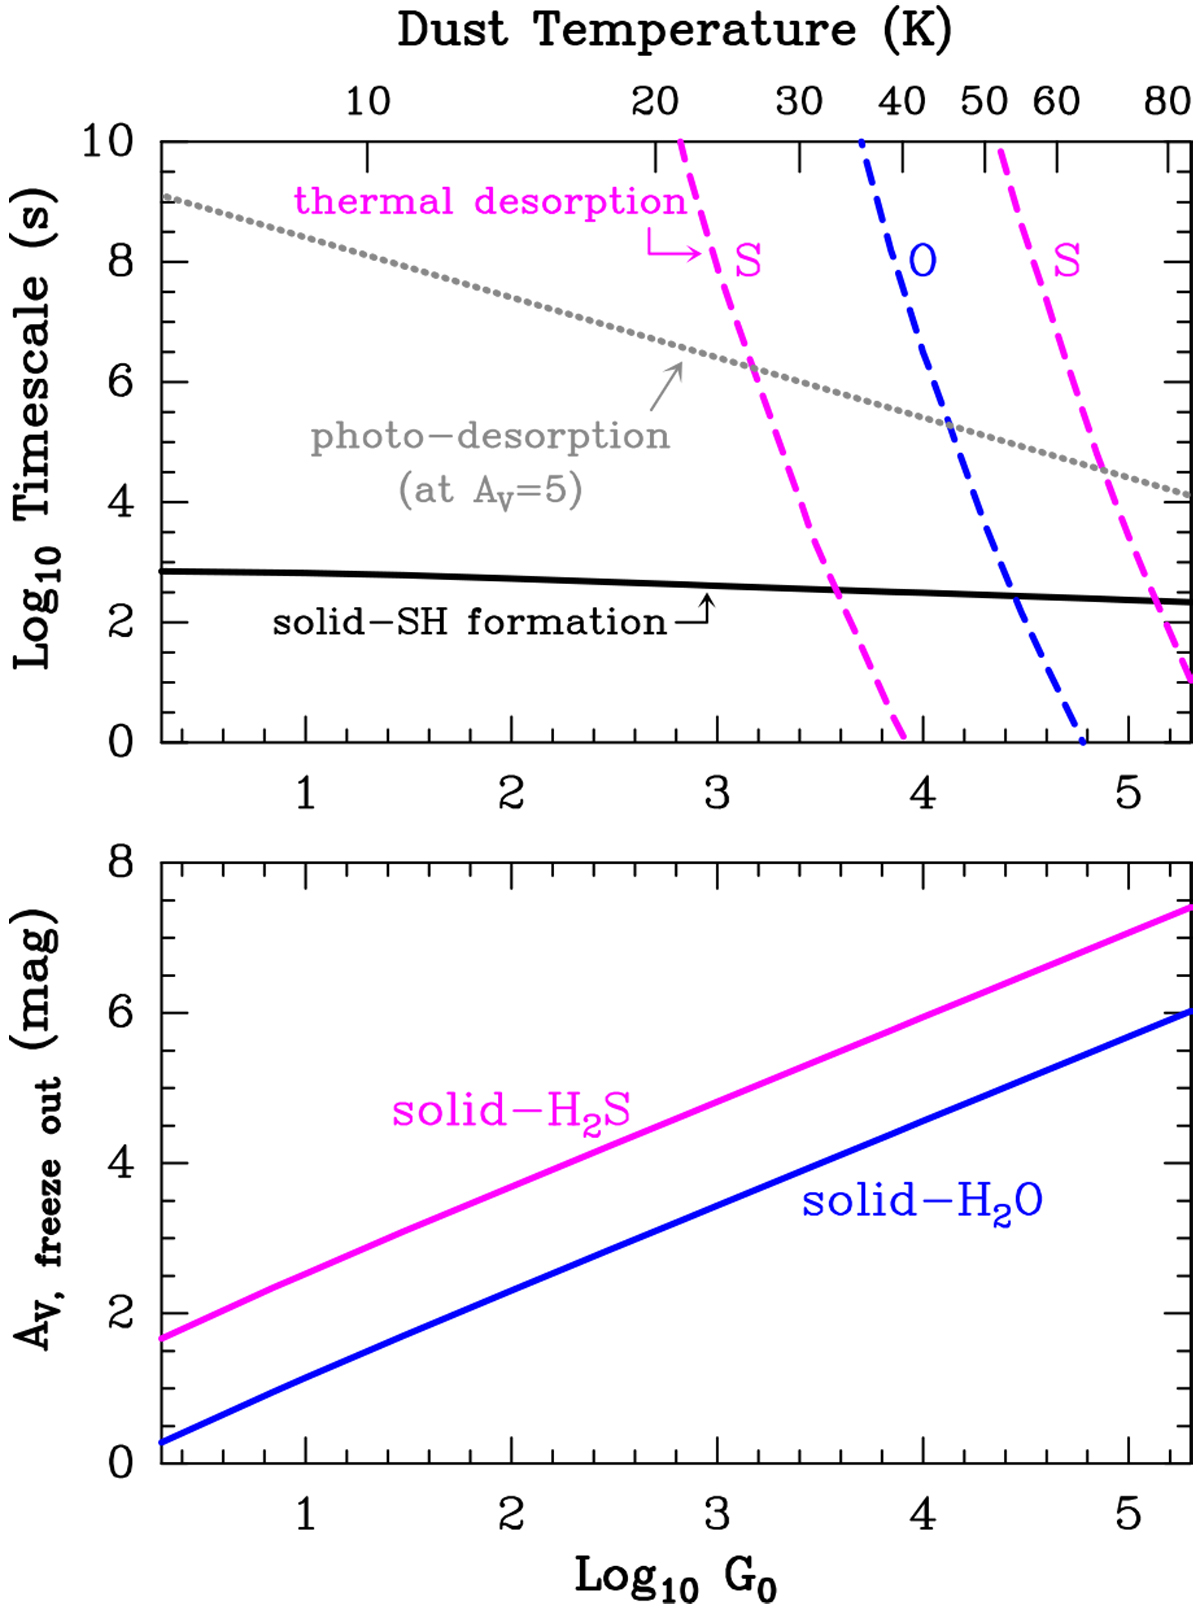
Representative timescales relevant to the formation of s-H2S and s-H2O as well as their freeze-out depths. Upper panel: the continuous black curve is the timescale for a grain to be hit by an H atom. Once in the grain surface, the H atom diffuses and can react with an adsorbed S atom to form s-SH. The dashed magenta curves show the timescale for thermal desorption of an s-S atom (Eb ∕k (S) = 1100 K left curve, and 2600 K right curve) and of an s-O atom (blue curve; Eb∕k (O) = 1800 K). The gray dotted curve is the photodesorption timescale of s-S. At G0 values where the continuous line is below the dashed and dotted lines, s-O and s-S atoms remain on grain surfaces sufficiently long to combine with an adsorbed H atom and form s-OH and s-SH (and then s-H2 O and s-H2S). These timescales are for nH = 105 cm−3 and n(H) = 100 cm−3. Bottom panel: freeze-out depth at which most O and S are incorporated as s-H2 O and s-H2S (assuming no chemical desorption and Tk = Td).
Current usage metrics show cumulative count of Article Views (full-text article views including HTML views, PDF and ePub downloads, according to the available data) and Abstracts Views on Vision4Press platform.
Data correspond to usage on the plateform after 2015. The current usage metrics is available 48-96 hours after online publication and is updated daily on week days.
Initial download of the metrics may take a while.