Fig. 12
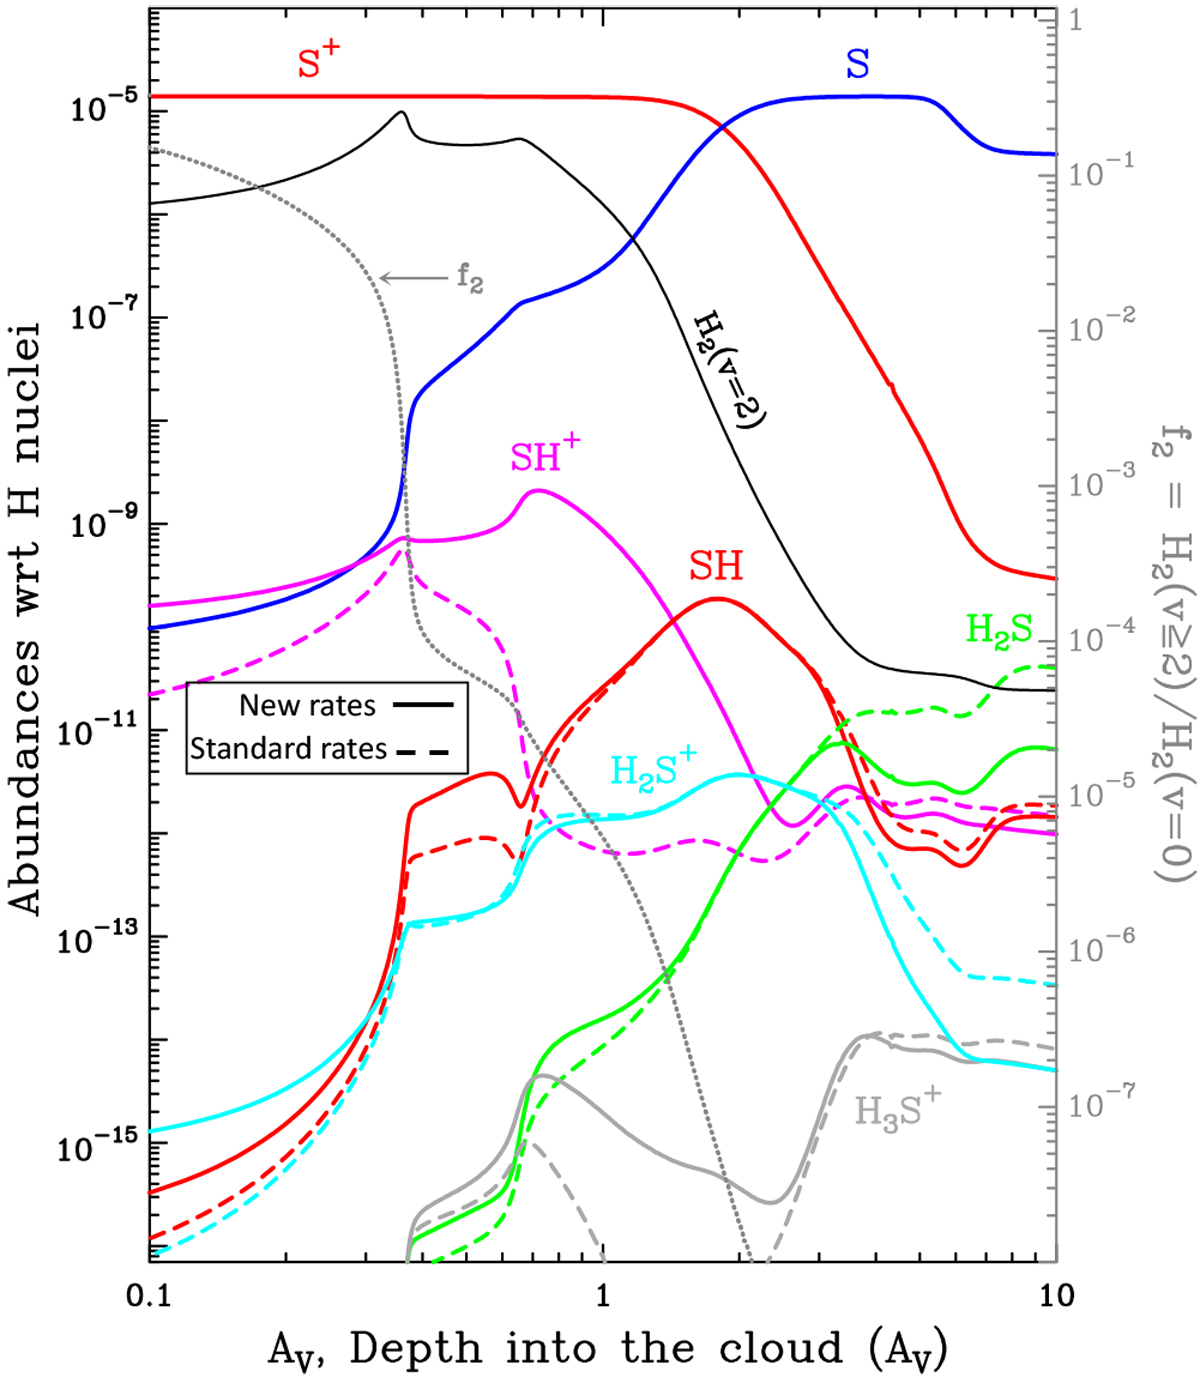
Pure gas-phase PDR models of the Orion Bar. Continuous curves show fractional abundances as a function of cloud depth, in logarithm scale to better display the irradiated edge of the PDR, using the new reaction rates listed in Table 1. The gray dotted curve shows f2, the fraction of H2 that is in vibrationally excited levels v ≥ 2 (right axis scale). Dashed curves are for a model using standard reaction rates.
Current usage metrics show cumulative count of Article Views (full-text article views including HTML views, PDF and ePub downloads, according to the available data) and Abstracts Views on Vision4Press platform.
Data correspond to usage on the plateform after 2015. The current usage metrics is available 48-96 hours after online publication and is updated daily on week days.
Initial download of the metrics may take a while.