Fig. 1
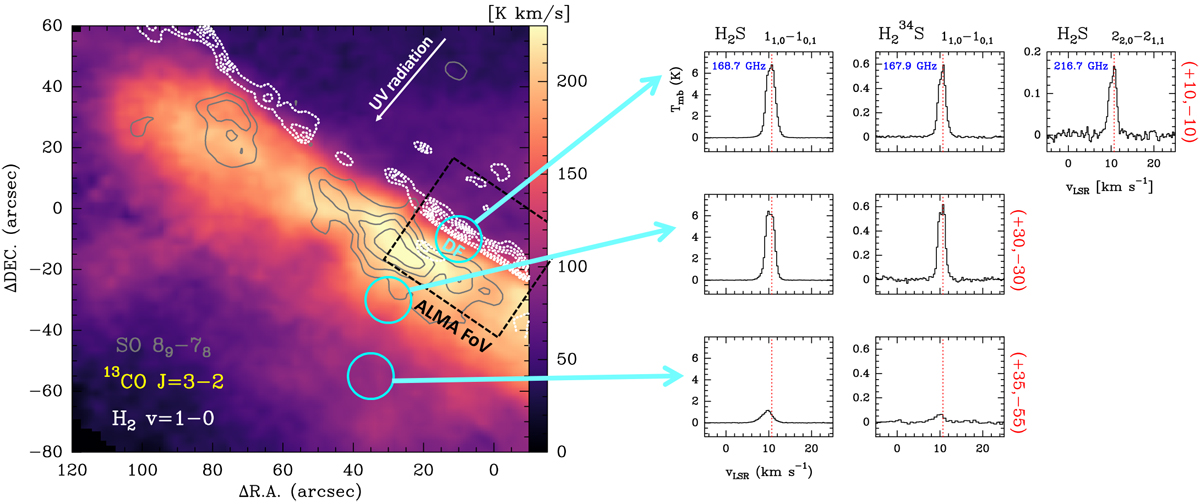
Overview of the Orion Bar. The (0″, 0″) position corresponds to α2000 = 05h 35m 20.1s ; δ2000 = -05°25′07.0″. Left panel: integrated line intensity maps in the 13CO J = 3–2 (color scale) and SO 89–78 emission (gray contours; from 6 to 23.5 K km s−1 in steps of 2.5 K km s−1) obtained with the IRAM 30 m telescope at 8″ resolution. The white dotted contours delineate the position of the H2 dissociation front as traced by the infrared H2 v = 1–0 S(1) line (from 1.5 to 4.0 × 10⁻⁴ erg s−1 cm−2 sr−1 in steps of 0.5 × 10⁻⁴ erg s−1 cm−2 sr−1; from Walmsley et al. 2000). The black-dashed rectangle shows the smaller FoV imaged with ALMA (Fig. 3). The DF position has been observed with SOFIA, IRAM 30 m, and Herschel. Cyan circles represent the ~15″ beam at 168 GHz. Right panel: H2S lines lines detected toward three positions of the Orion Bar.
Current usage metrics show cumulative count of Article Views (full-text article views including HTML views, PDF and ePub downloads, according to the available data) and Abstracts Views on Vision4Press platform.
Data correspond to usage on the plateform after 2015. The current usage metrics is available 48-96 hours after online publication and is updated daily on week days.
Initial download of the metrics may take a while.