Fig. 5.
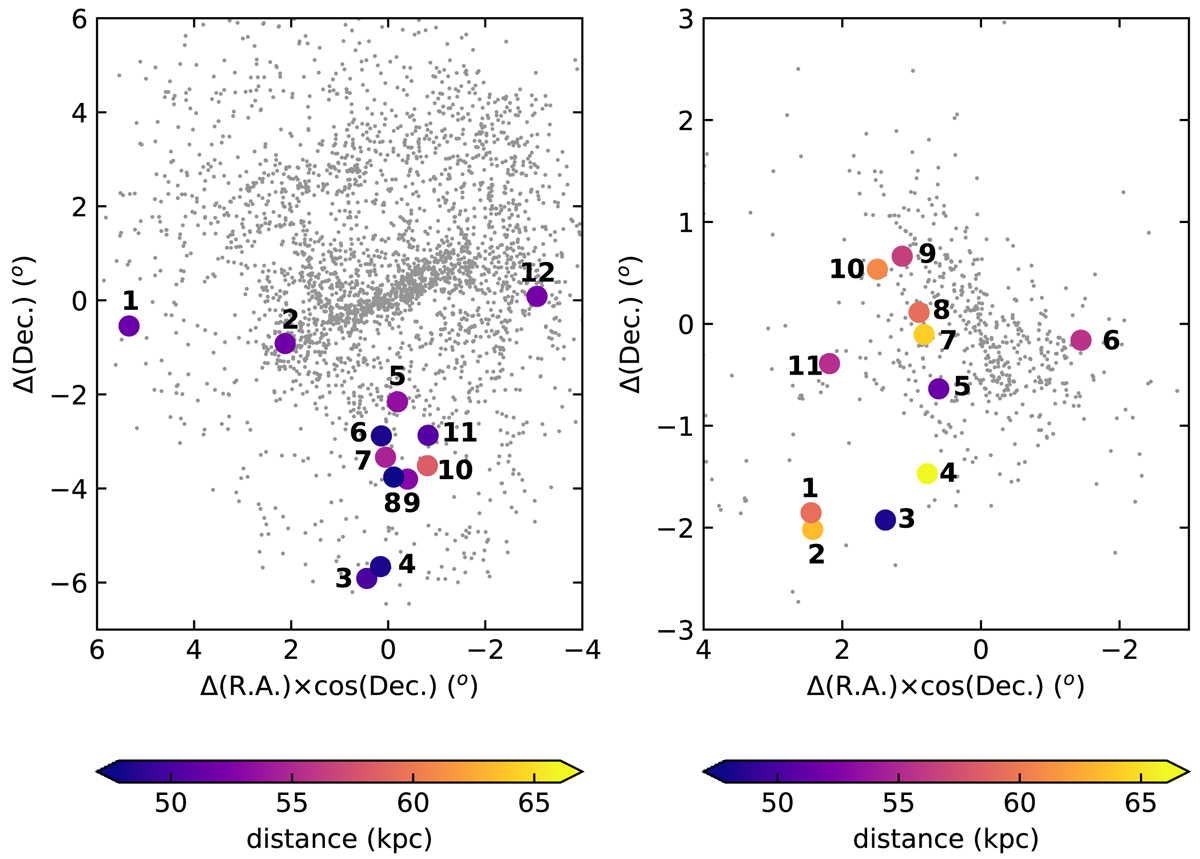
Spatial distribution of the MC clusters. North is up and east to the left. Gray points are star clusters in the Bica et al. (2008)’s catalog, while color-coded large circles represent the studied star cluster sample. Left LMC: 1 = Field 55−01; 2 = Field 51−01; 3 = Field 44−01; 4 = Field 44−02; 5 = Field 40−01; 6 = Field 40−02; 7 = Field 40−06; 8 = Field 40−04; 9 = Field 40−05; 10 = Field 40−07; 11 = Field 40−03; 12 = Field 30−01. Right SMC: 1 = Field 16−02; 2 = Field 16−01; 3 = Field 12−01; 4 = Field 11−03; 5 = Field 11−02; 6 = Field 4−01; 7 = Field 11−01; 8 = Field 10−03; 9 = Field 10−01; 10 = Field 10−02; 11 = Field 15−01.
Current usage metrics show cumulative count of Article Views (full-text article views including HTML views, PDF and ePub downloads, according to the available data) and Abstracts Views on Vision4Press platform.
Data correspond to usage on the plateform after 2015. The current usage metrics is available 48-96 hours after online publication and is updated daily on week days.
Initial download of the metrics may take a while.