Fig. 9
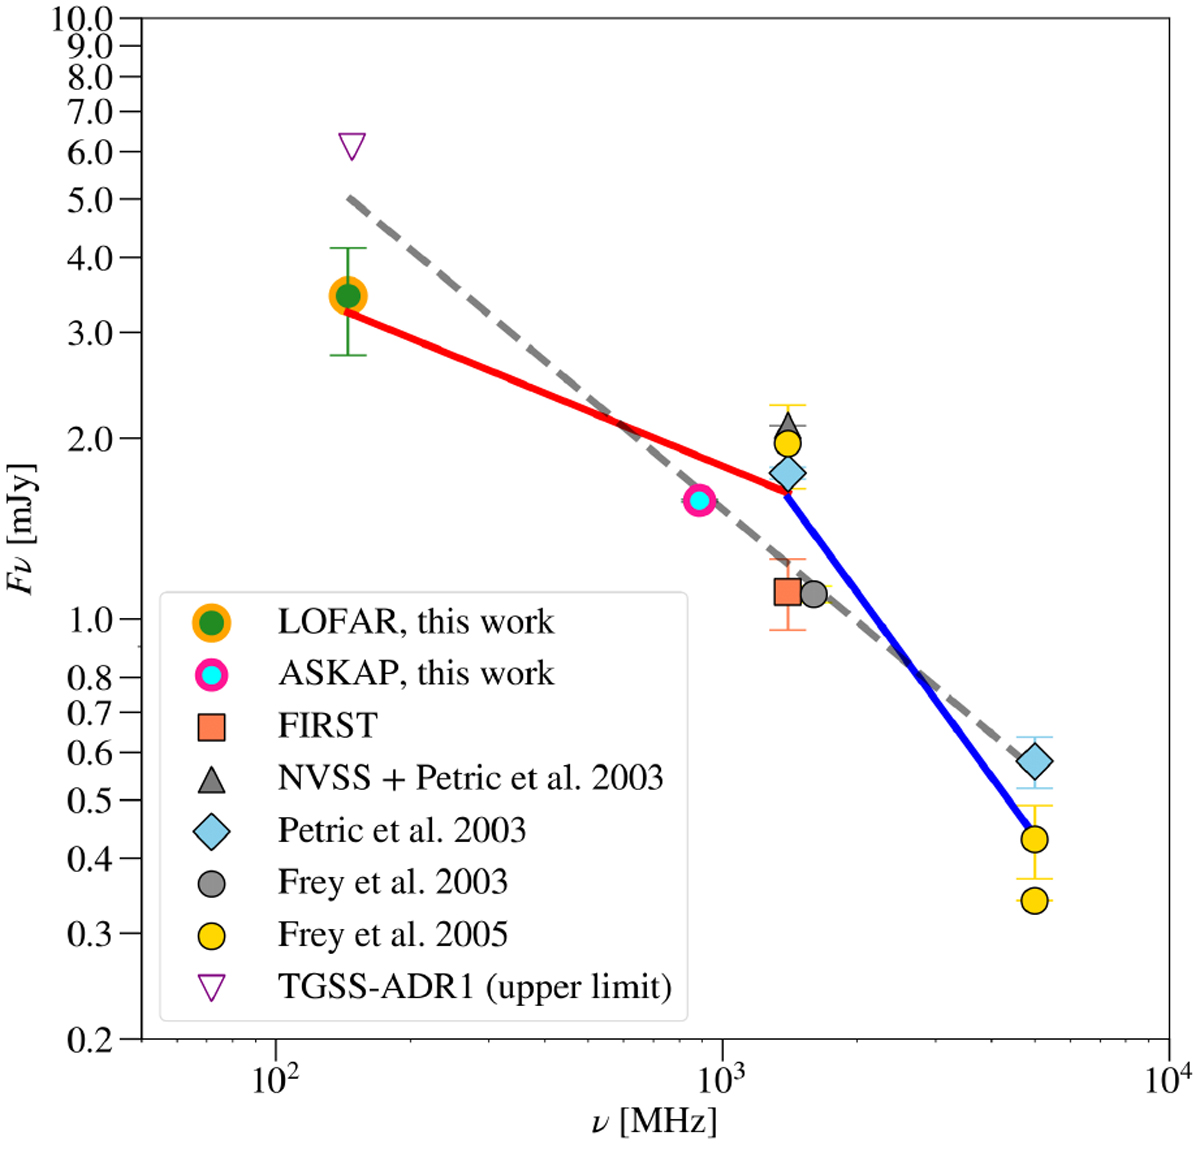
Radio spectrum of SDSSJ08. The coloured markers present radio measurements from the literature. The empty triangle shows the TGSS-ADR1 upper limit which is not used for spectral fitting. At frequencies above ~ 1 GHz, the spectrum appears steep. The LOFAR 145 MHz (green and orange point) and the ASKAP 888 MHz (cyan and red point) flux densities reported in this work confirm a flattening of the spectrum at frequencies below ~ 1 GHz. The red and blue lines show the best-fitting spectra with the indices of − 0.30 ± 0.13 and − 1.02 ± 0.16 in the frequency ranges below and above 1.4 GHz, respectively. The best-fitting line for all data points with an index of − 0.62 ± 0.12 is shown with the grey dashed line.
Current usage metrics show cumulative count of Article Views (full-text article views including HTML views, PDF and ePub downloads, according to the available data) and Abstracts Views on Vision4Press platform.
Data correspond to usage on the plateform after 2015. The current usage metrics is available 48-96 hours after online publication and is updated daily on week days.
Initial download of the metrics may take a while.