Open Access
Fig. 8
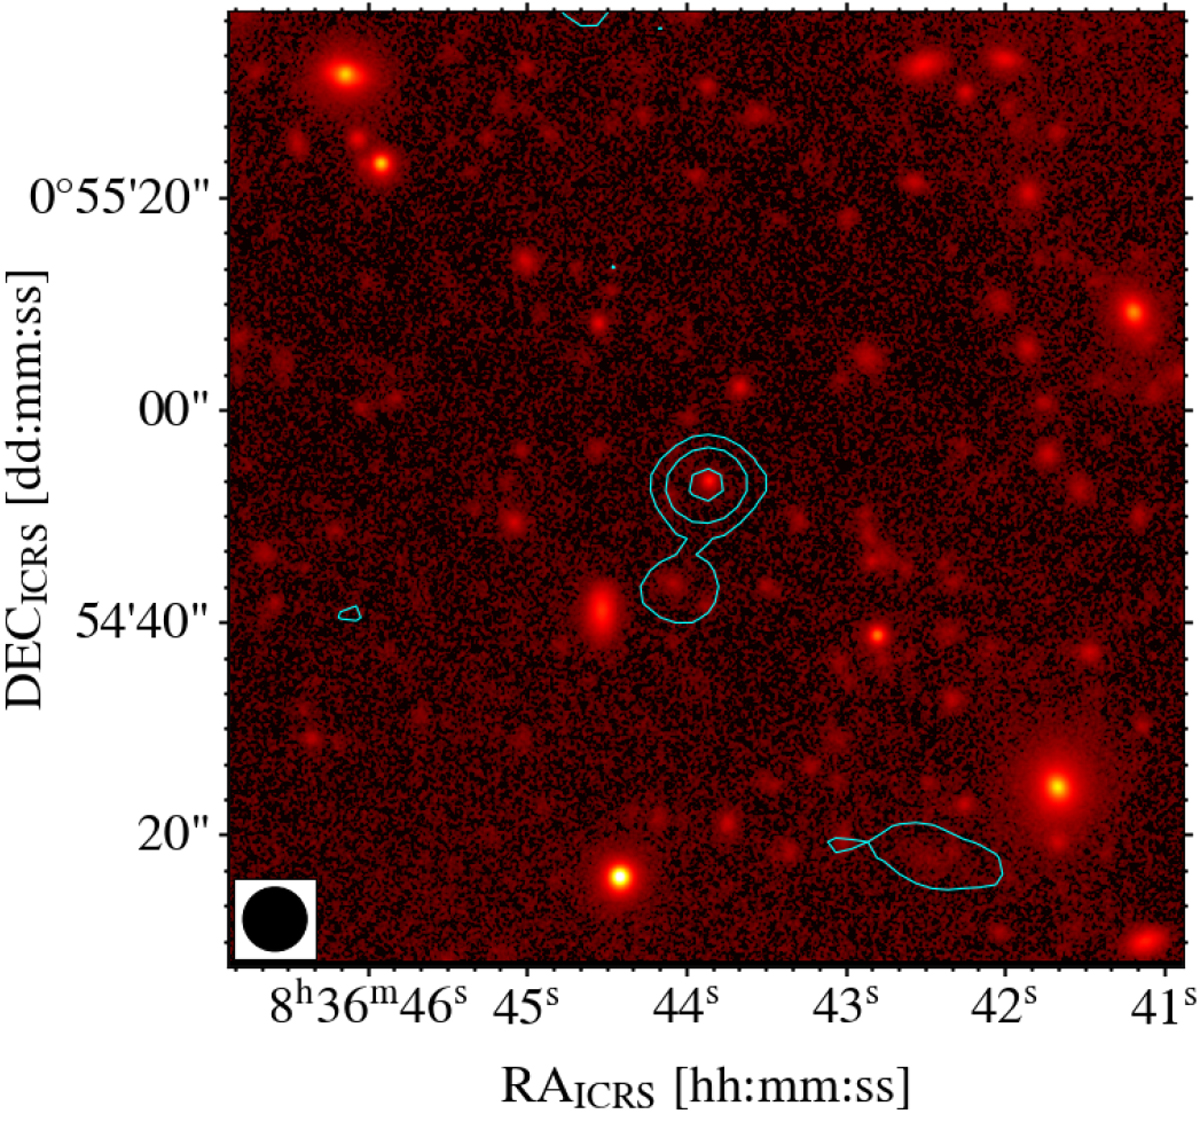
LOFAR 145 MHz contours on top of the HSC z-band image (right). The contour levels are [1, 2, 4] × 3σ, where σ = 200 μJy beam−1. The beam size of 6″ × 6″ is shown in the bottom left corner. The field corresponds to the square in Fig. 2.
Current usage metrics show cumulative count of Article Views (full-text article views including HTML views, PDF and ePub downloads, according to the available data) and Abstracts Views on Vision4Press platform.
Data correspond to usage on the plateform after 2015. The current usage metrics is available 48-96 hours after online publication and is updated daily on week days.
Initial download of the metrics may take a while.