Fig. 6
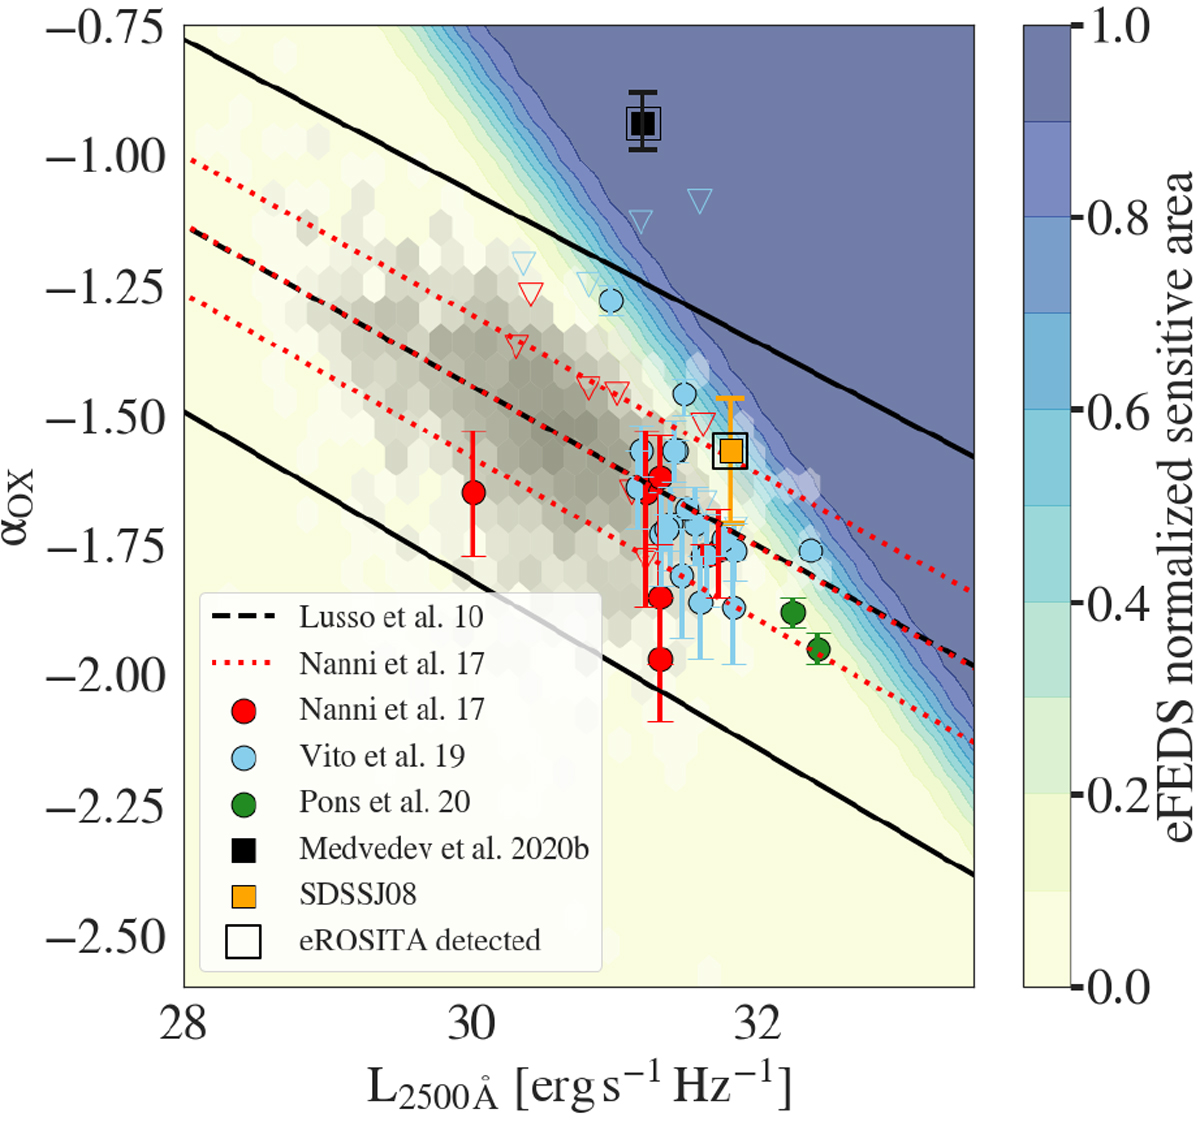
X-ray-to-optical slope anti-correlates with the UV monochromatic luminosity at 2500 Å. SDSSJ08 (orange circle) is consistent with the best-fitting relation of Lusso et al. (2010, dashed line) and Nanni et al. (2017, red dotted line). The z > 5.7 X-ray-detected sources from Nanni et al. (2017, restricted to z < 6 and ignoring SDSSJ08), Vito et al. (2019) and Pons et al. (2020) are shown. The empty triangles denote upper limits from undetected sources (same colour code as detected sources). The grey density scale shows a sample of 2685 XMM-Newton-detected z < 5 SDSS quasars (Lusso & Risaliti 2016). The contours show the eFEDS normalised, sensitive area derived from synthetic power-law spectra at z = 6 with Γ = 2 and Galactic absorption. We note that CFHQJ14 (black point) tends towards flatter αOX values than X-ray-detected quasars at similar UV luminosities. Its αOX was computed from the luminosity reported in Medvedev et al. (2020b).
Current usage metrics show cumulative count of Article Views (full-text article views including HTML views, PDF and ePub downloads, according to the available data) and Abstracts Views on Vision4Press platform.
Data correspond to usage on the plateform after 2015. The current usage metrics is available 48-96 hours after online publication and is updated daily on week days.
Initial download of the metrics may take a while.