Open Access
Fig. 4
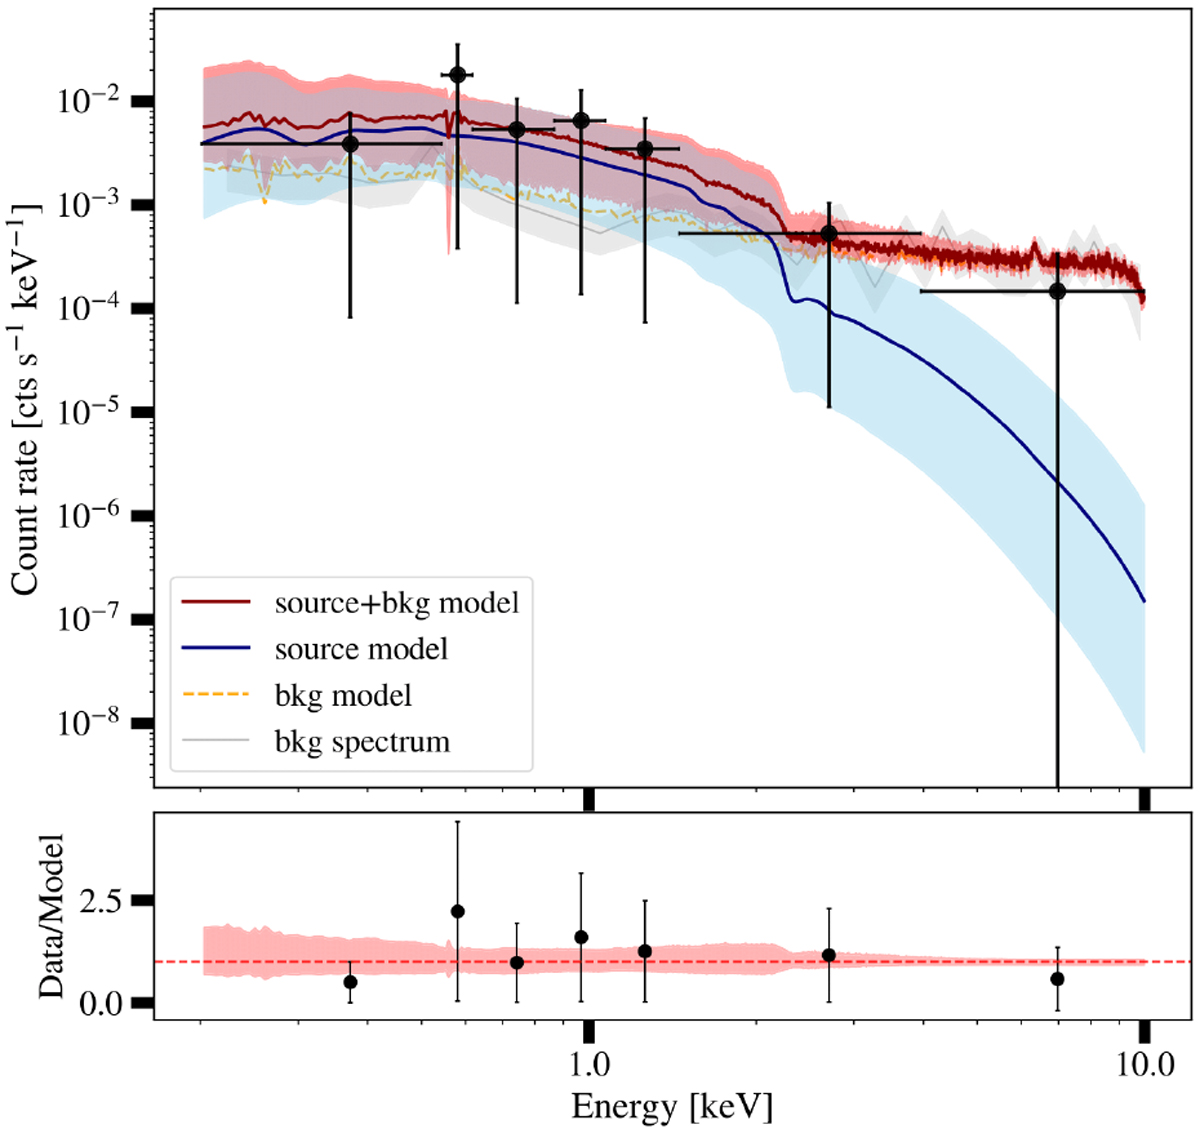
X-ray spectrum for eFEDSU J083644.0+005459. The observed count rates are shown in black. The fit was performed in the range 0.3–8.0 keV. The fitted source model (blue) and combined source and background model (red) are also presented. The residuals are shown in the lower panel.
Current usage metrics show cumulative count of Article Views (full-text article views including HTML views, PDF and ePub downloads, according to the available data) and Abstracts Views on Vision4Press platform.
Data correspond to usage on the plateform after 2015. The current usage metrics is available 48-96 hours after online publication and is updated daily on week days.
Initial download of the metrics may take a while.