Fig. 1
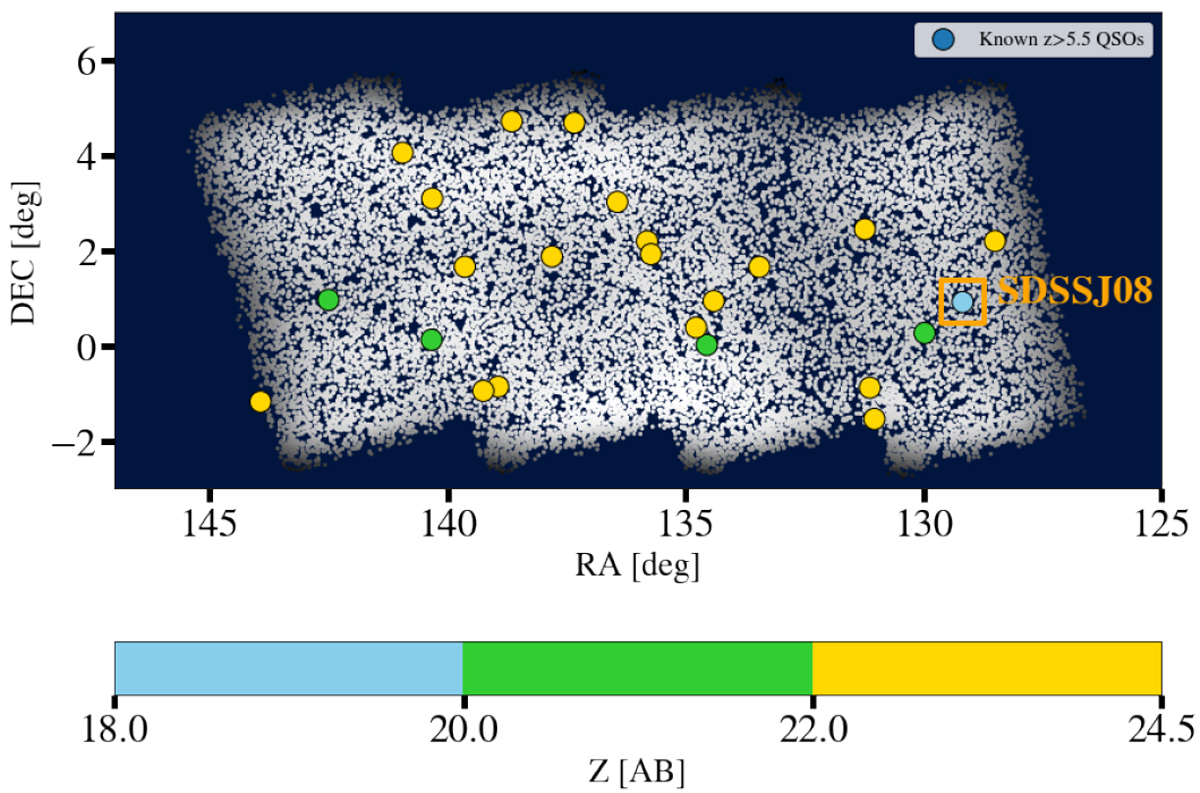
Detected point-like sources in eFEDS colour-coded according to their spatial density (brighter is denser). The visible difference in source density is due to the non-uniform exposure of the eFEDS field (Brunner et al., in prep). Known z > 5.5 QSOs in the footprint are shown as circles and are colour-coded according to their z-band magnitude. The detected quasar is marked by an orange square.
Current usage metrics show cumulative count of Article Views (full-text article views including HTML views, PDF and ePub downloads, according to the available data) and Abstracts Views on Vision4Press platform.
Data correspond to usage on the plateform after 2015. The current usage metrics is available 48-96 hours after online publication and is updated daily on week days.
Initial download of the metrics may take a while.