Free Access
Fig. 4
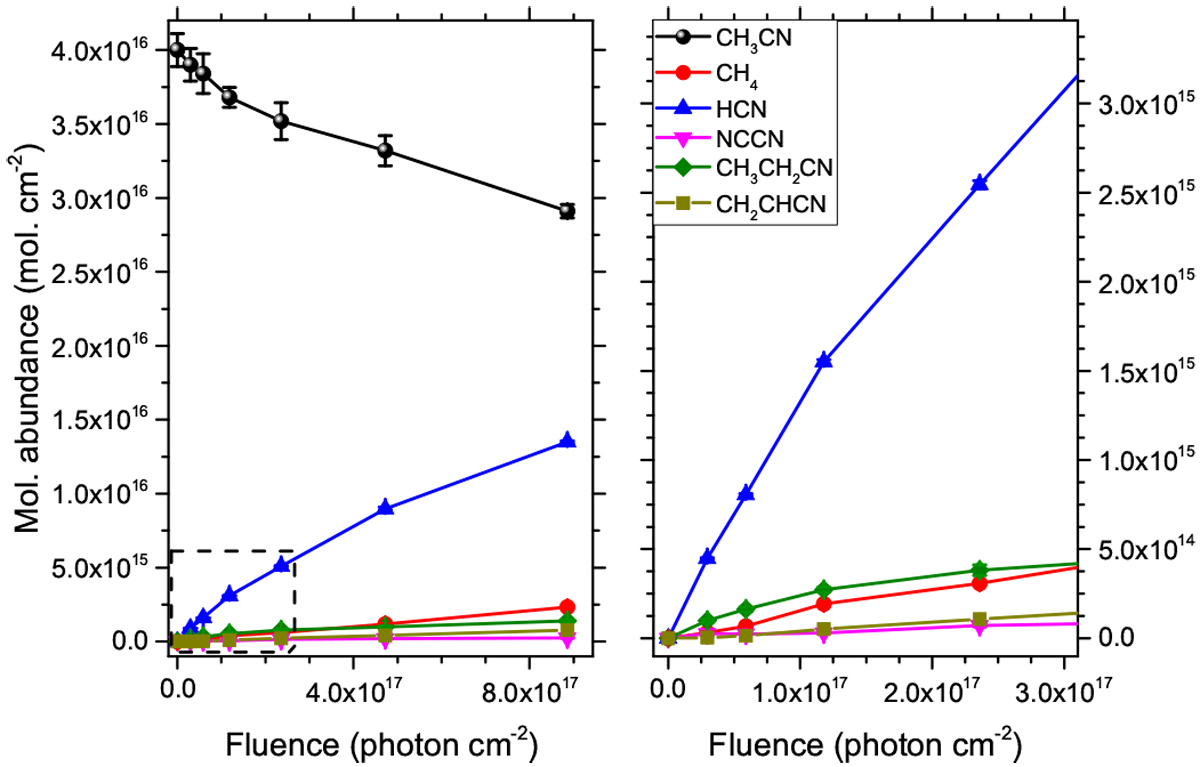
Left panel: molecular abundances of species during the UV photolysis of CH3 CN ice as function of photon fluence. Right panel: zoom in of the low fluence region indicated in the left panel.
Current usage metrics show cumulative count of Article Views (full-text article views including HTML views, PDF and ePub downloads, according to the available data) and Abstracts Views on Vision4Press platform.
Data correspond to usage on the plateform after 2015. The current usage metrics is available 48-96 hours after online publication and is updated daily on week days.
Initial download of the metrics may take a while.