Fig. 3.
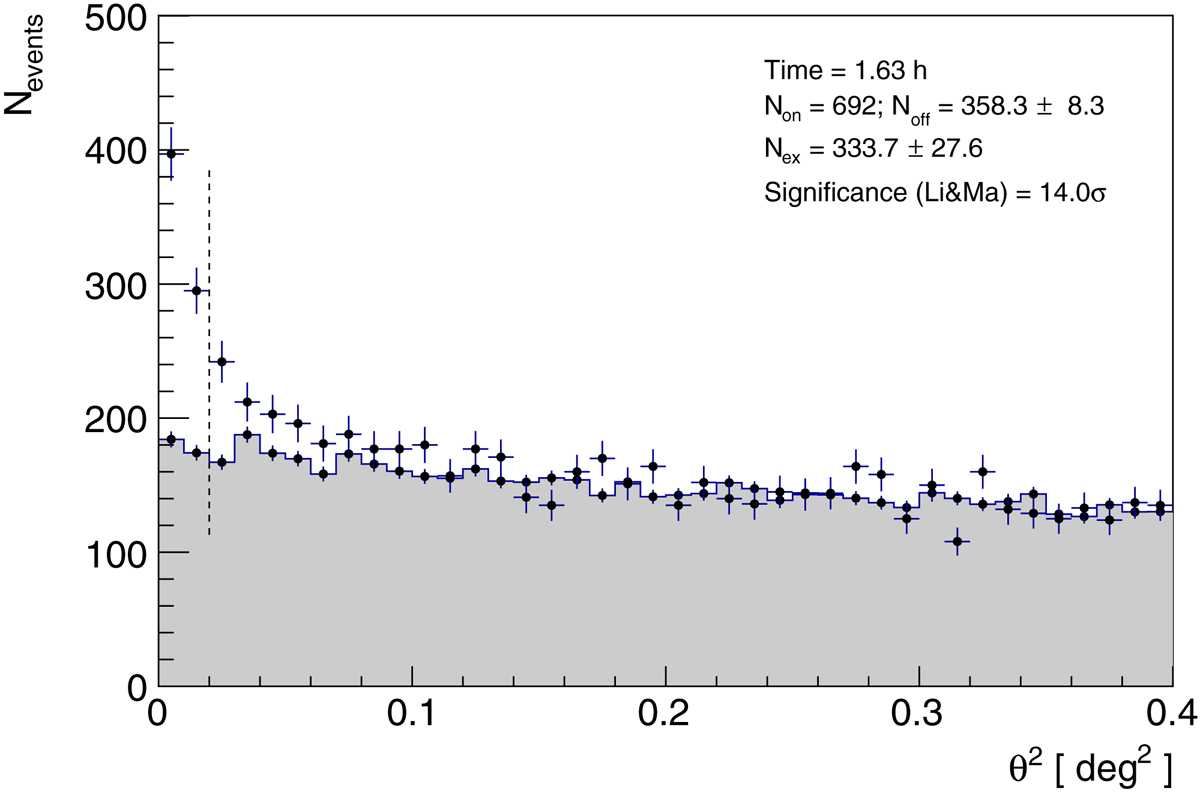
Distribution of the squared angular distance between the source nominal and event reconstructed directions (points) and corresponding background estimation (shaded region) for the night of 2020 January 20 (MJD = 58868) of MAGIC observations. Vertical line shows the cut value below which the event statistics are given in the inset.
Current usage metrics show cumulative count of Article Views (full-text article views including HTML views, PDF and ePub downloads, according to the available data) and Abstracts Views on Vision4Press platform.
Data correspond to usage on the plateform after 2015. The current usage metrics is available 48-96 hours after online publication and is updated daily on week days.
Initial download of the metrics may take a while.