Fig. 2.
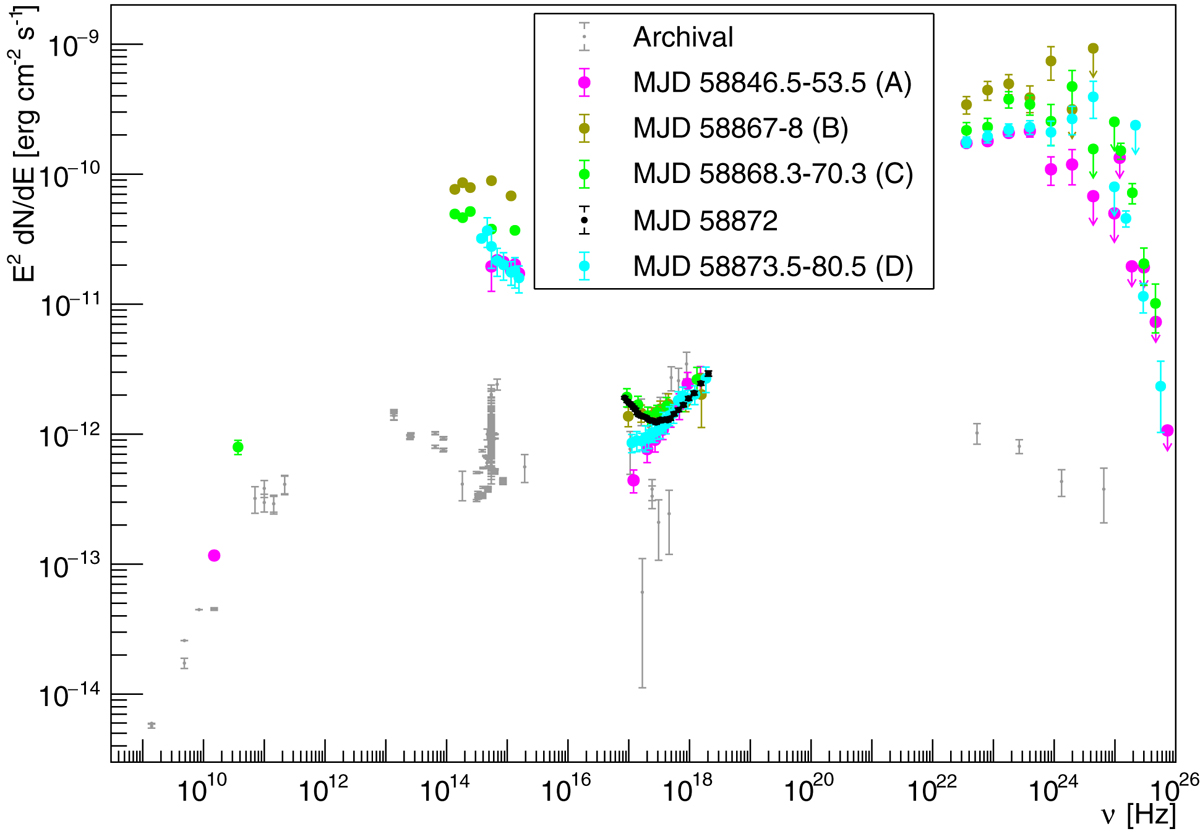
MWL SED of QSO B1420+326 in 2020 January and February. Points follow the colors of the shaded regions in Fig. 1. In addition we show XMM points taken on 2020 January 24 (MJD = 58872) in black. MAGIC points are not corrected for the EBL absorption. Gray points show archival data (most from the ASI Space Science Data Center, but also including low-state Fermi-LAT spectrum and lowest and highest X-ray spectrum from Swift-XRT).
Current usage metrics show cumulative count of Article Views (full-text article views including HTML views, PDF and ePub downloads, according to the available data) and Abstracts Views on Vision4Press platform.
Data correspond to usage on the plateform after 2015. The current usage metrics is available 48-96 hours after online publication and is updated daily on week days.
Initial download of the metrics may take a while.