Free Access
Fig. 11.
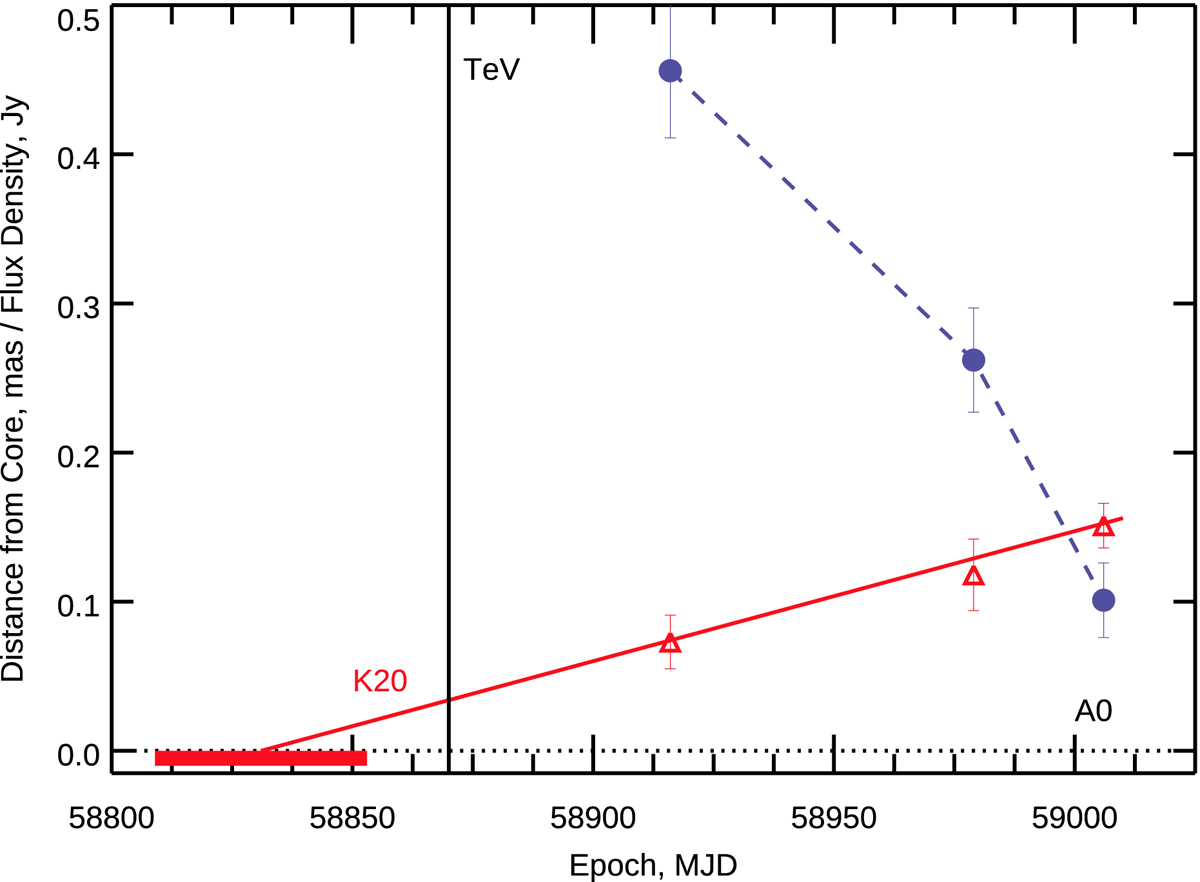
Separation of K20 from the core with time (red triangles) according to modeling; the red line represents a linear approximation of the motion. Blue circles and the dashed line correspond to the light curve of K20 at 43 GHz; the black vertical line indicates the time of the VHE event.
Current usage metrics show cumulative count of Article Views (full-text article views including HTML views, PDF and ePub downloads, according to the available data) and Abstracts Views on Vision4Press platform.
Data correspond to usage on the plateform after 2015. The current usage metrics is available 48-96 hours after online publication and is updated daily on week days.
Initial download of the metrics may take a while.