Fig. 10.
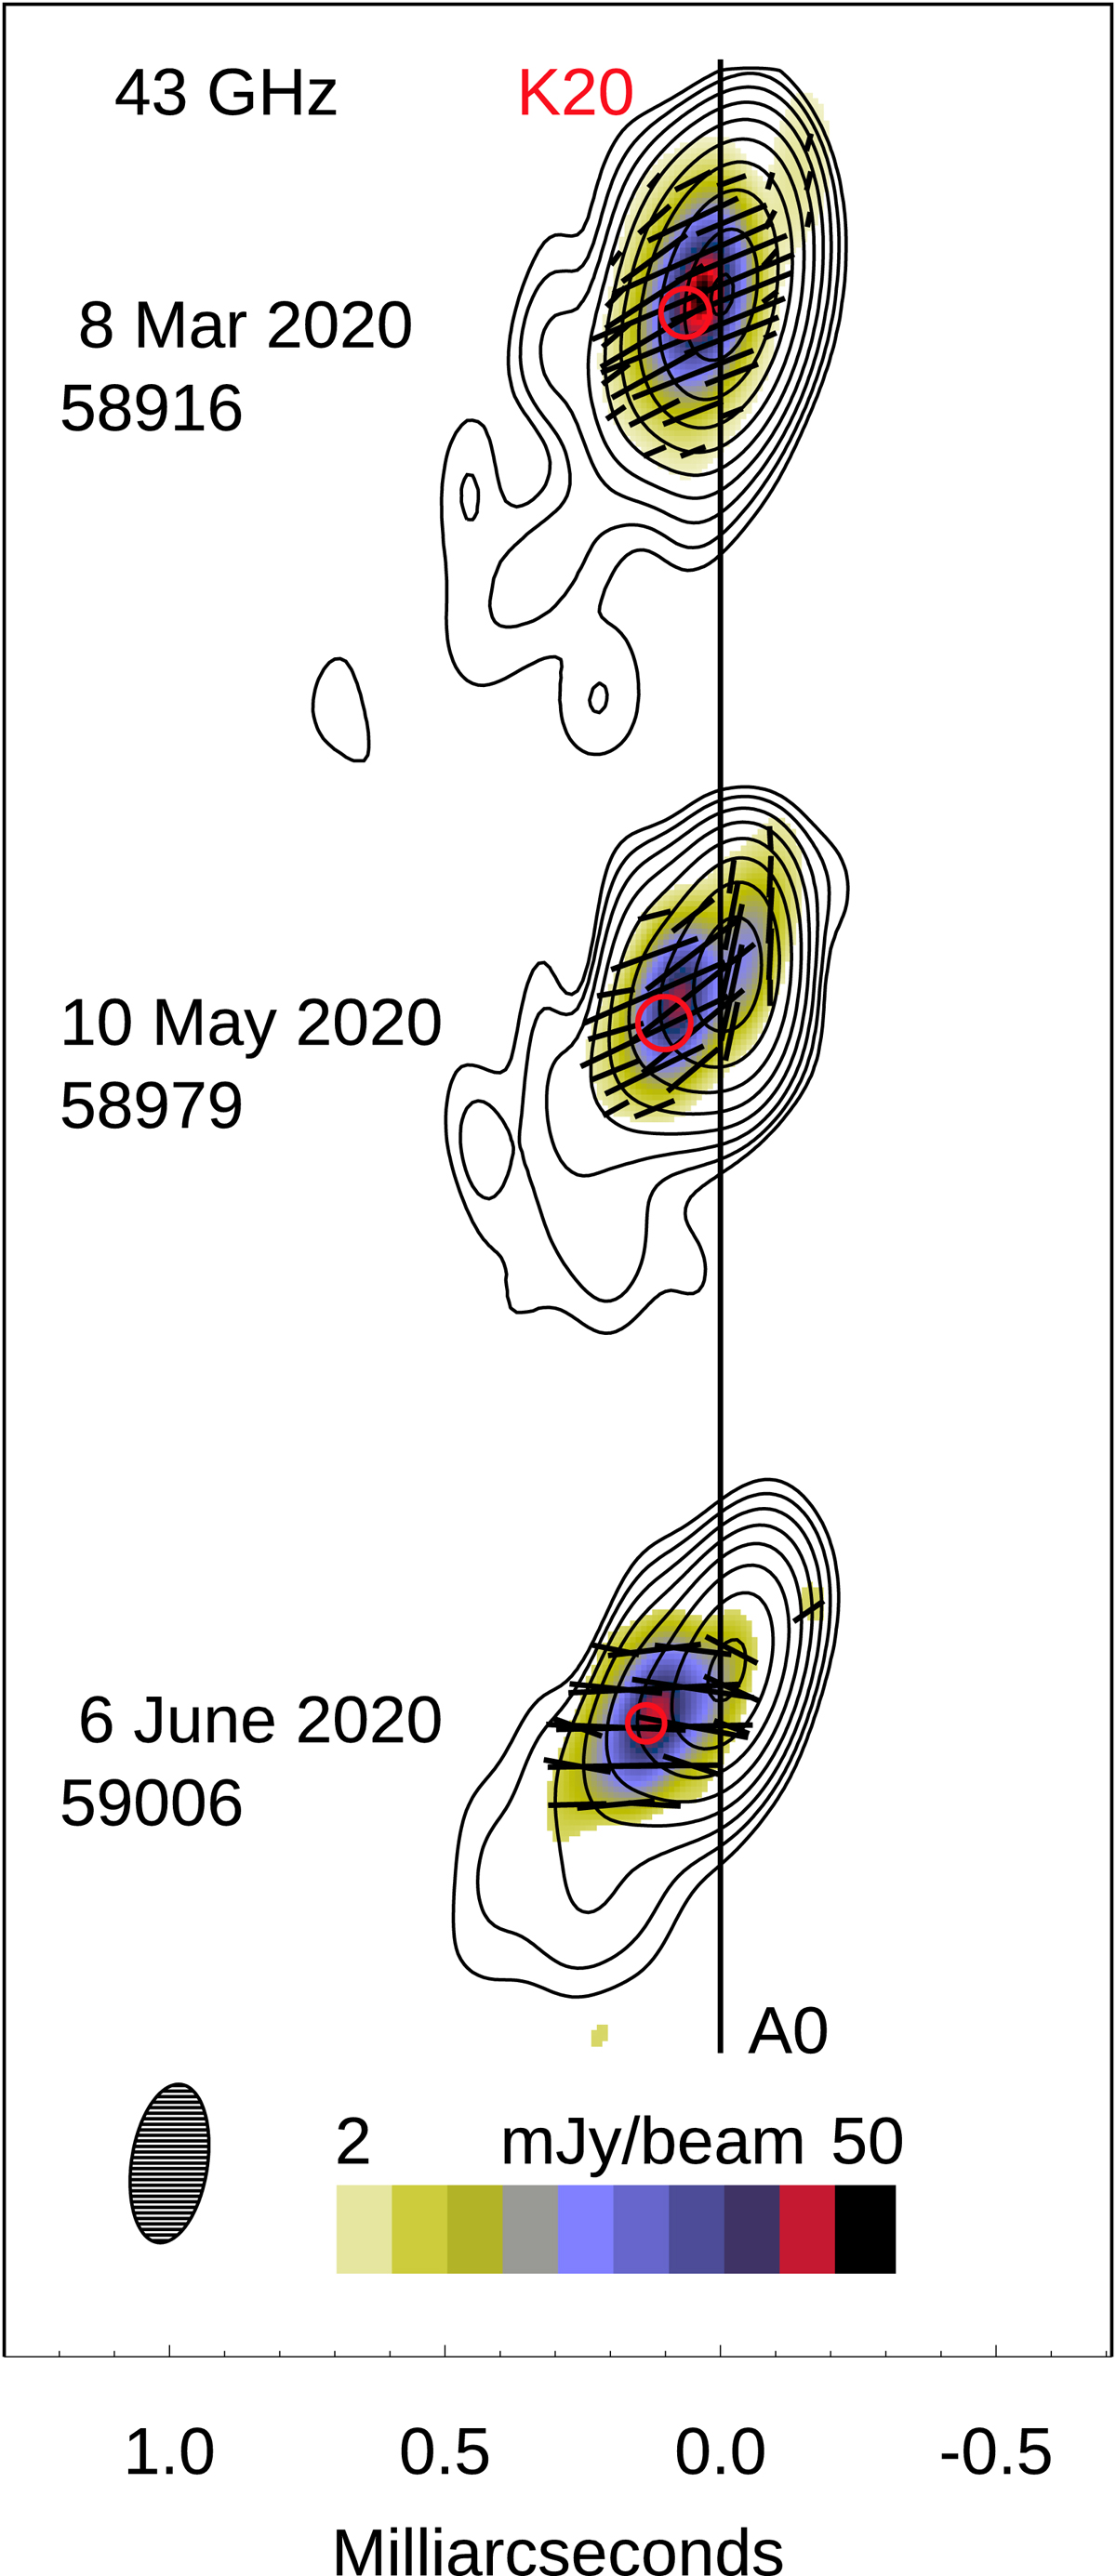
Total (contours) and polarized (color scale) intensity maps of QSO B1420+326 obtained with the VLBA at 43 GHz; the peak total intensity is 1.14 Jy beam−1; the beam is displayed in the bottom left corner; the contours are 0.25, 0.5, 1, ...64, and 90% of the peak total intensity. Linear segments within images show direction of polarization, the black vertical line indicates the position of the core, A0, and red circles mark positions of knot K20; 1 mas corresponds to 7.29 pc. We note that the polarized flux intensities on May 10 and June 6 are multiplied by factors of three and five, respectively, to reveal locations of peaks of polarized flux intensity, which are 15 mJy beam−1 and 9.5 mJy beam−1, respectively, for the May 10 (MJD = 58979) and June 6 (MJD = 59006) images.
Current usage metrics show cumulative count of Article Views (full-text article views including HTML views, PDF and ePub downloads, according to the available data) and Abstracts Views on Vision4Press platform.
Data correspond to usage on the plateform after 2015. The current usage metrics is available 48-96 hours after online publication and is updated daily on week days.
Initial download of the metrics may take a while.