Fig. 1.
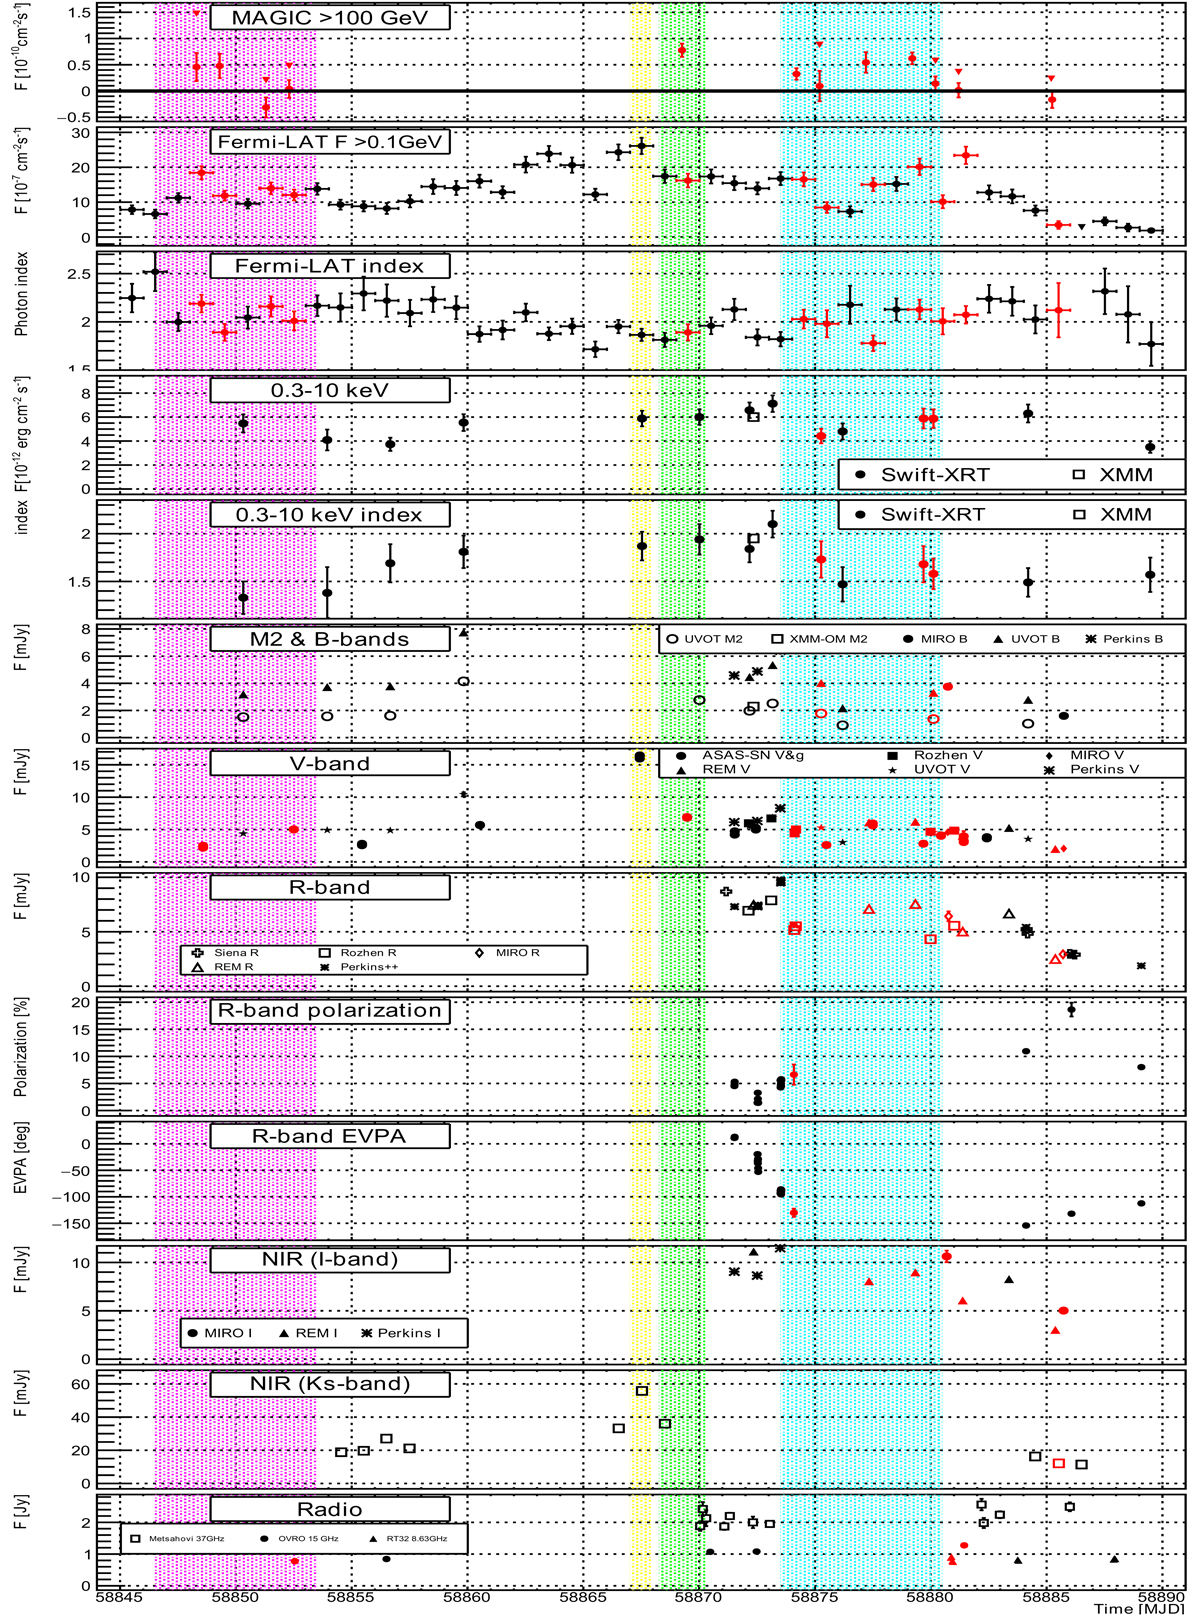
MWL light curve of QSO B1420+326 between 2019 December 28 (MJD = 58845) and 2020 February 11 (MJD = 58890); see titles and legends of individual panels. Optical and UV observations are corrected for the Galactic attenuation. The points in red are contemporaneous (±12 h) with MAGIC observations. The shaded regions show the time ranges of the four considered flare evolution periods (see Table 2). Flux upper limits in the first two panels are shown with downward triangles.
Current usage metrics show cumulative count of Article Views (full-text article views including HTML views, PDF and ePub downloads, according to the available data) and Abstracts Views on Vision4Press platform.
Data correspond to usage on the plateform after 2015. The current usage metrics is available 48-96 hours after online publication and is updated daily on week days.
Initial download of the metrics may take a while.