Fig. 9
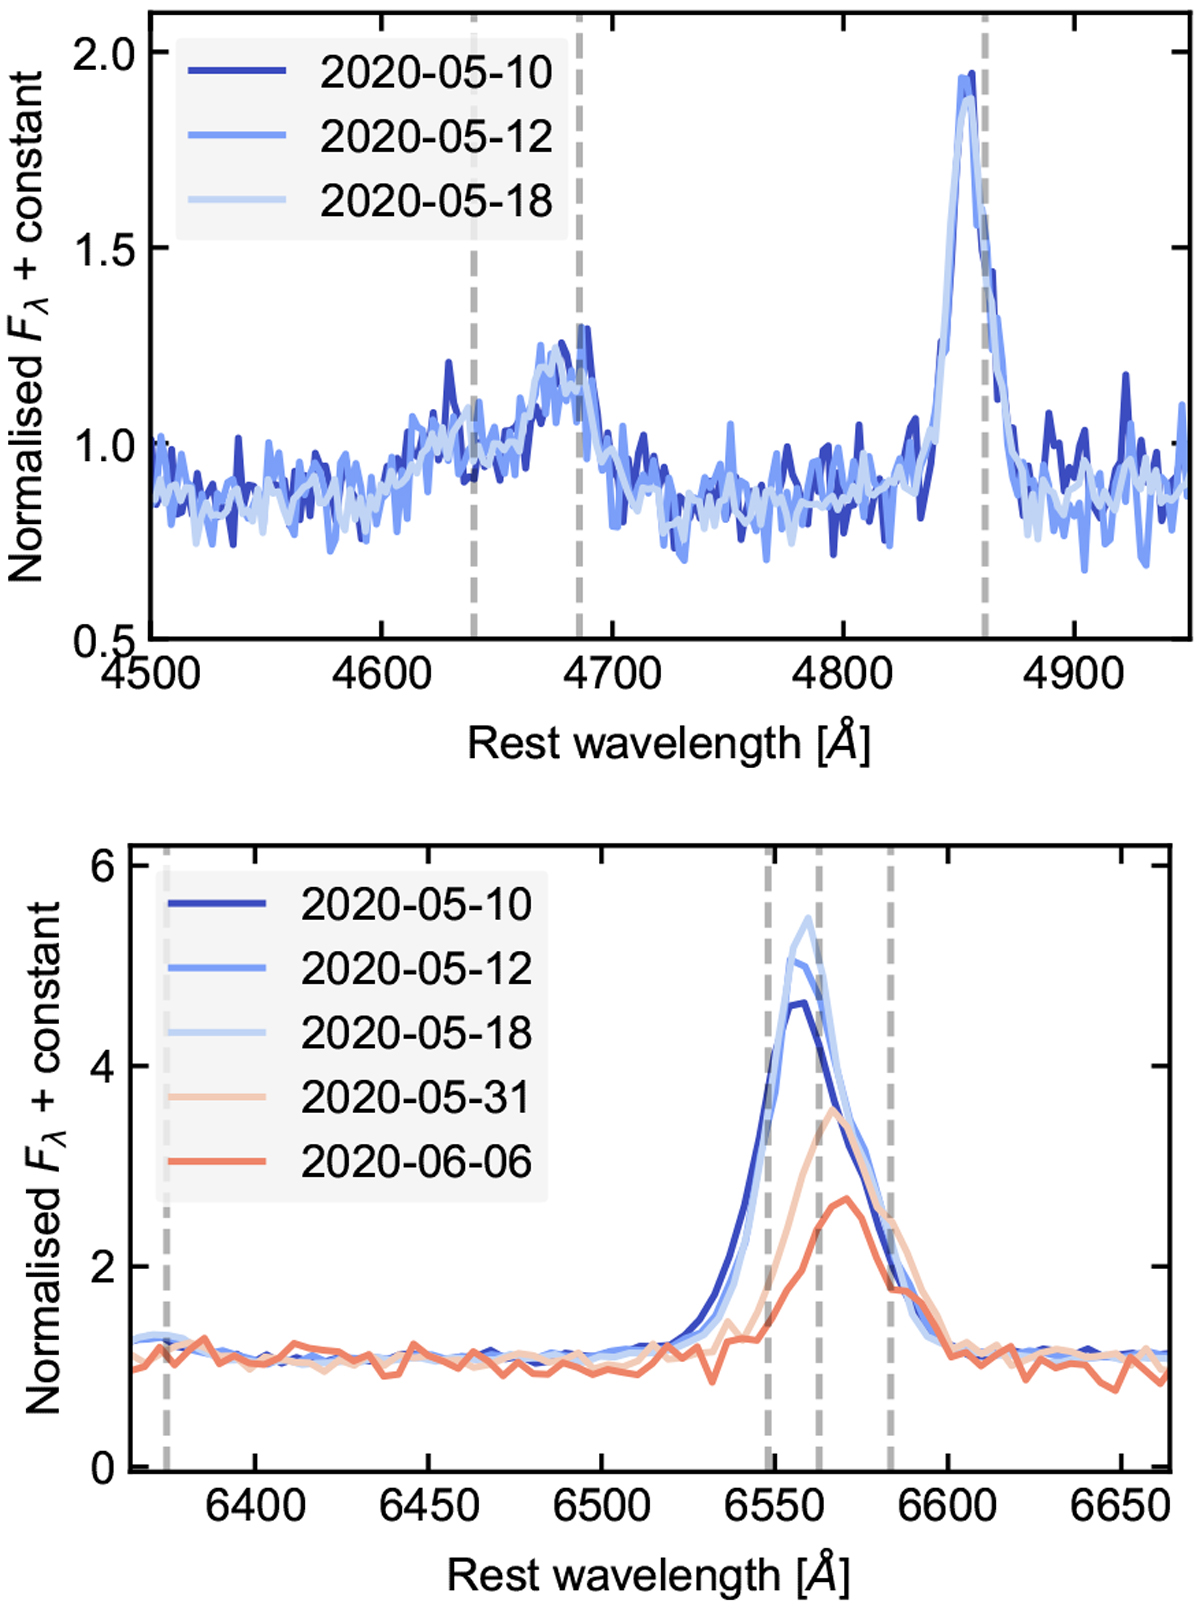
Evolution of the Bowen+Hβ (top) and Hα (bottom) Balmer emission lines observed through the five epochs of FLOYDS spectroscopy. Grey dashed lines match those in Fig. 8. Epochs 2020-05-31 and 2020-06-06 were of low S/N in the blue wavelength range, and thus are omitted from the plot here. The minor evolution of the Hα peak position over the FLOYDS spectra was deemed to be most likely due to aperture-related effects during observations.
Current usage metrics show cumulative count of Article Views (full-text article views including HTML views, PDF and ePub downloads, according to the available data) and Abstracts Views on Vision4Press platform.
Data correspond to usage on the plateform after 2015. The current usage metrics is available 48-96 hours after online publication and is updated daily on week days.
Initial download of the metrics may take a while.