Fig. 8
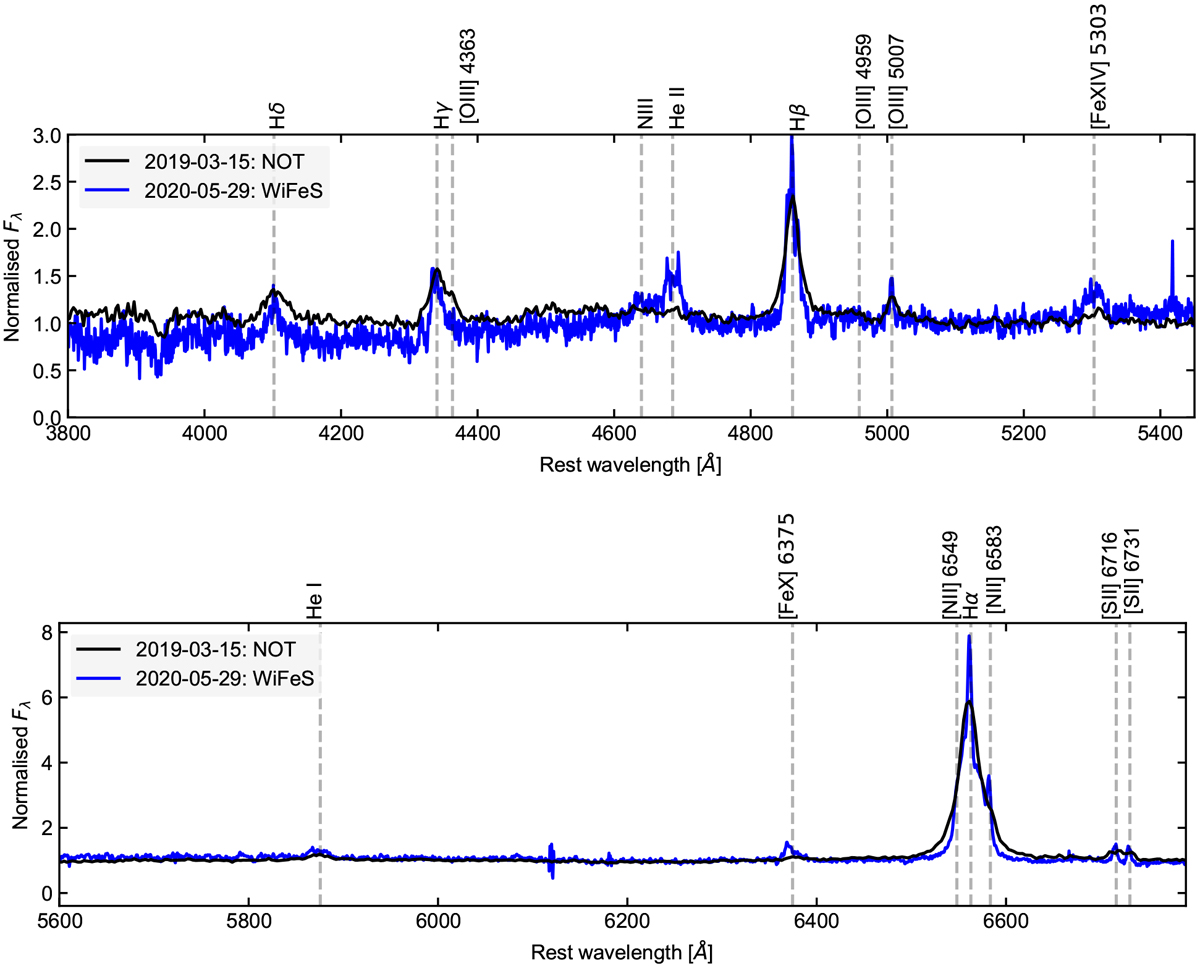
Comparison of NOT and WiFeS spectra (black and blue respectively). Top panel: wavelength range 3800–5450 Å, while bottompanel: 5600–6800 Å range. The most notable changes are (a) the emergence of the broad emission feature around rest-frame wavelength 4686 Å and (b) an increase in intensity of the high-ionisation coronal Fe lines (~5300 and 6370 Å).The WiFeS spectrum is of much higher resolution relative to the NOT spectrum, and therefore is able to better resolve narrow emission lines, such as the [S II] doublet at 6716 and 6731 Å. Neither are shown corrected for Galactic extinction. The NOT spectrum was normalised by its continuum flux in the 5100–5200 Å range (rest frame), whilst the blue and red arms of the WiFeS spectra were normalised in the 5100–5200 and 6400–6450 Å ranges respectively (rest frame).
Current usage metrics show cumulative count of Article Views (full-text article views including HTML views, PDF and ePub downloads, according to the available data) and Abstracts Views on Vision4Press platform.
Data correspond to usage on the plateform after 2015. The current usage metrics is available 48-96 hours after online publication and is updated daily on week days.
Initial download of the metrics may take a while.