Fig. 7
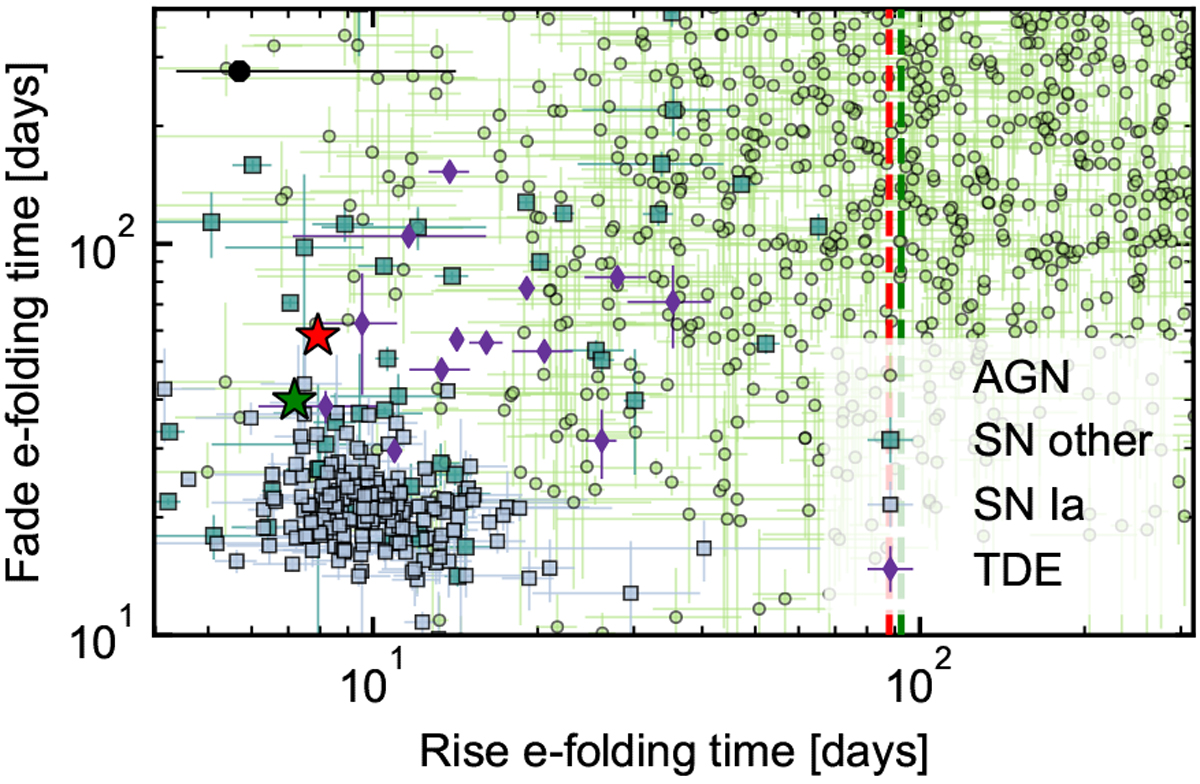
AT 2019avd variability compared with previously classified ZTF nuclear transients (non-AT 2019avd data presented originally in van Velzen et al. 2020), with red and green stars computed from the fitted model components for each respective filter. The red and green vertical lines mark the e-folding rise time of the second optical peak in the r and g bands, respectively. We also plot the rise and decay e-fold timescales inferred from the ASAS-SN V-band light curve of the nuclear transient AT 2017bgt (Trakhtenbrot et al. 2019a; see also Sect. 5.1) with a black marker. Not only is the double-peaked light curve of AT 2019avd clearly distinct from the other light curves of sources in the AT 2017bgt nuclear transient class, but the first peak of AT 2019avd decays much faster than the AT 2017bgt flare, whilst the second peak rises much slower than the AT 2017bgt flare.
Current usage metrics show cumulative count of Article Views (full-text article views including HTML views, PDF and ePub downloads, according to the available data) and Abstracts Views on Vision4Press platform.
Data correspond to usage on the plateform after 2015. The current usage metrics is available 48-96 hours after online publication and is updated daily on week days.
Initial download of the metrics may take a while.