Fig. 3
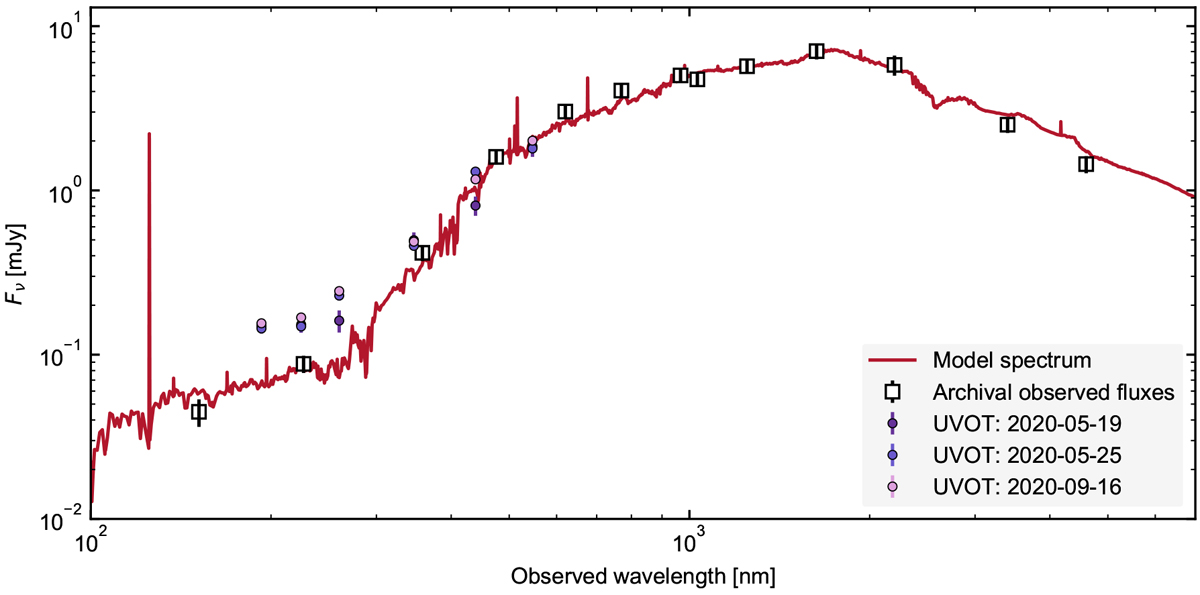
Spectral energy distribution of the host galaxy of AT 2019avd compiled from archival GALEX, SDSS, UKIDSS, and ALLWISE photometry, with the best-fit model shown as a red solid line. The three epochs of Swift UVOT photometry where all filters were used are also plotted. AT 2019avd shows a ~ 1 mag rise in the UVW1, UVM2, and UVW1 bands relative to the best fit model to the archival photometry.
Current usage metrics show cumulative count of Article Views (full-text article views including HTML views, PDF and ePub downloads, according to the available data) and Abstracts Views on Vision4Press platform.
Data correspond to usage on the plateform after 2015. The current usage metrics is available 48-96 hours after online publication and is updated daily on week days.
Initial download of the metrics may take a while.