Fig. 2
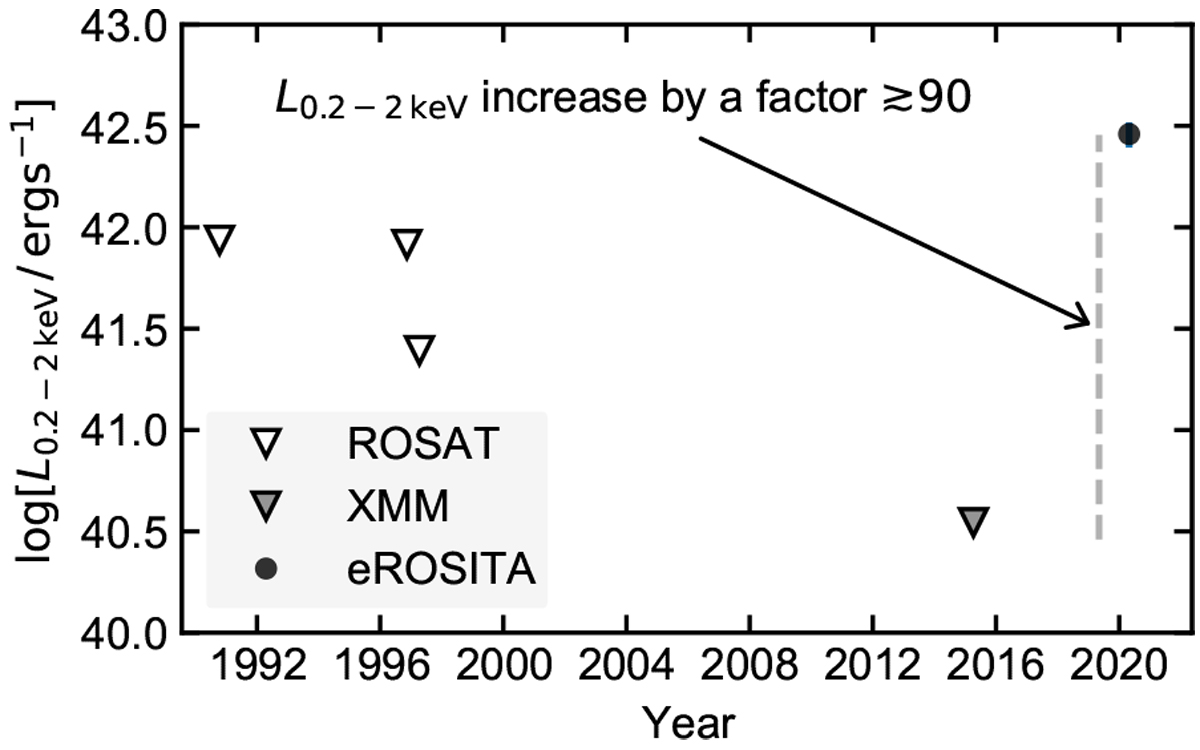
Long-term X-ray light curve in the 0.2–2 keV energy band of AT 2019avd up until the first eROSITA observation. Triangles denote 3σ upper limits for ROSAT/PSPC and XMM-Newton/EPIC-pn, whilst the black circle marks the SRG/eROSITA discovery, where AT 2019avd is at least 90 times brighter than the XMM-Newton 3σ upper limit. The error bar on the eROSITA marker encloses the 68% credible region on the observed luminosity.
Current usage metrics show cumulative count of Article Views (full-text article views including HTML views, PDF and ePub downloads, according to the available data) and Abstracts Views on Vision4Press platform.
Data correspond to usage on the plateform after 2015. The current usage metrics is available 48-96 hours after online publication and is updated daily on week days.
Initial download of the metrics may take a while.