Open Access
Fig. B.1
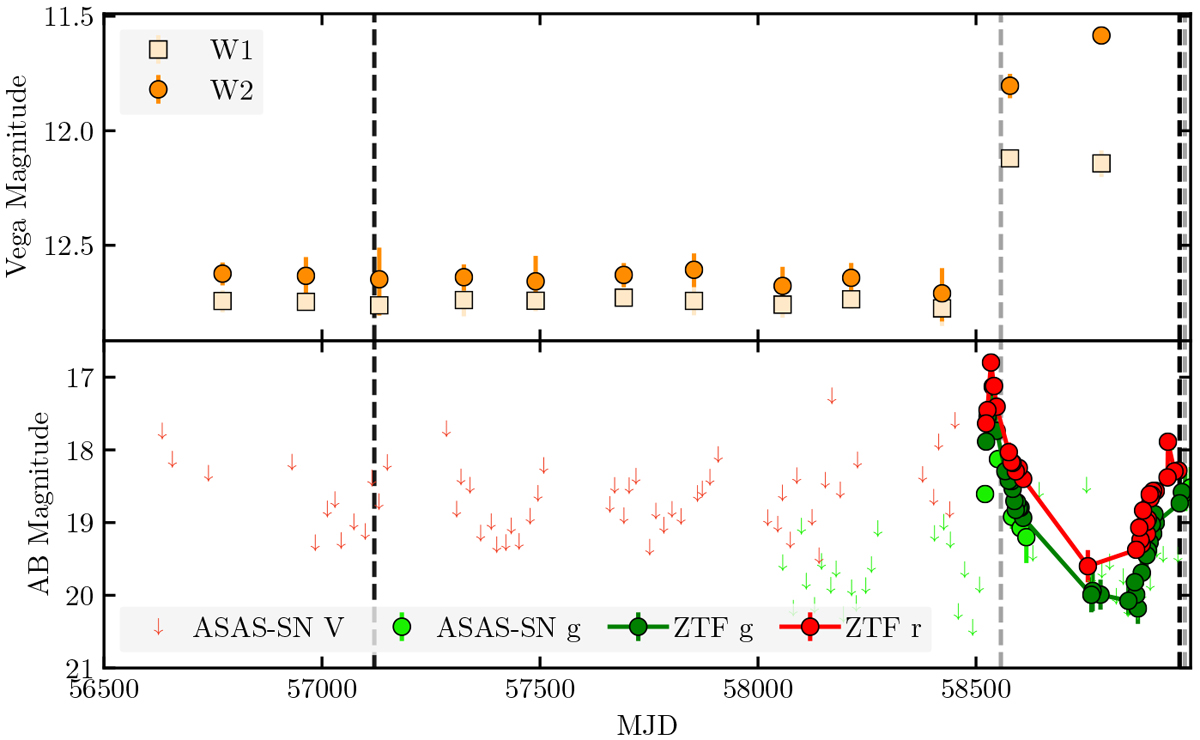
Long-term NEOWISE-R, ASAS-SN, and ZTF light curves of AT 2019avd. The early and late black dashed lines mark the 2015 XMM-Newton pointed and the 2020 eROSITA eRASS1 observations respectively. The early and late grey dashed linesmark the MJD that the NOT and first FLOYDS spectra were taken.
Current usage metrics show cumulative count of Article Views (full-text article views including HTML views, PDF and ePub downloads, according to the available data) and Abstracts Views on Vision4Press platform.
Data correspond to usage on the plateform after 2015. The current usage metrics is available 48-96 hours after online publication and is updated daily on week days.
Initial download of the metrics may take a while.