Fig. 14
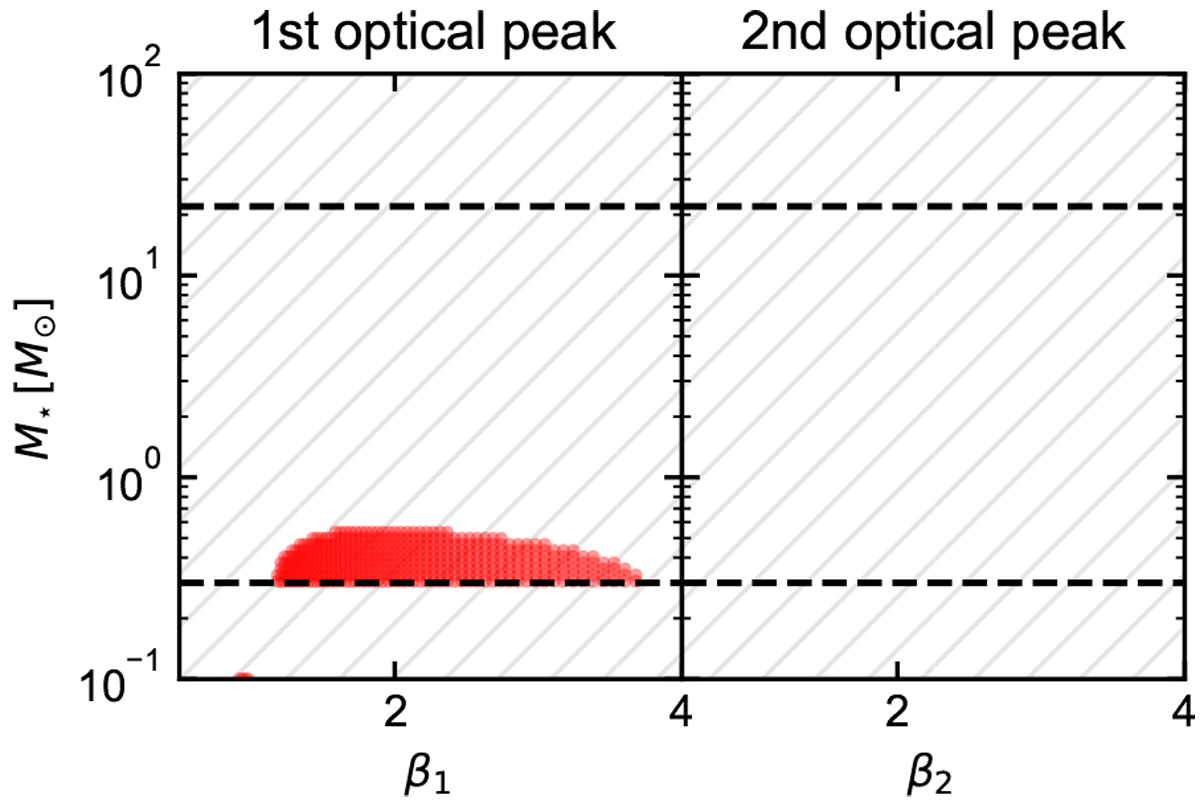
Constraints on the M⋆, β parameter space, obtained for explaining the origin of AT 2019avd as a DTDE on SMBH. Red markers represent a permitted M⋆, β configuration, whilst a region that contains grey hashing represents a configuration that is not able to reproduce the observed timescales for the given peak. Results were obtained for a black hole with log [MBH∕M⊙] ~ 6.3. Since there are no red markers on the second optical peak plot, there is no permitted M⋆, β pairing that can reproduce the observed peak timescale for the second optical peak. The black dashed lines bound 0.3 M⊙ < M⋆ < 22 M⊙, where we adopt γ = 4∕3.
Current usage metrics show cumulative count of Article Views (full-text article views including HTML views, PDF and ePub downloads, according to the available data) and Abstracts Views on Vision4Press platform.
Data correspond to usage on the plateform after 2015. The current usage metrics is available 48-96 hours after online publication and is updated daily on week days.
Initial download of the metrics may take a while.